.webp)
Datafiles
Apr 09
A correlation analysis across 100 global retail banks in FY25 finds a weak but statistically significant negative relationship between asset…
TABInsights evaluates leading retail banks and ranks them across seven key dimensions: retail financial performance, retail focus, digital capability, brand strength, digital sales, customer experience and risk management. The assessment highlights trends in revenue growth, funding structures, cost management and digital engagement, offering insights on how banks adapt to an evolving landscape.
| Rank | FI | Country/Region | Financial Performance | Retail Focus | Digital Capability | Brand Strength | Sales Management | Customer Experience | Risk Management | Total Score | |||||||||||||||||||||
|---|---|---|---|---|---|---|---|---|---|---|---|---|---|---|---|---|---|---|---|---|---|---|---|---|---|---|---|---|---|---|---|
| Retail revenue | Revenue growth 1H25 | Revenue growth FY2021-24 | ROA | Improvements in ROA | CIR | Improvements in CIR | Total Score | Portion of book is retail | Total Score | Digital active | Definition of digital active | Total Score | Retail deposit | Deposit growth 1H25 | Deposit growth FY2021-24 | CASA ratio | Total Score | Digital sales | Fee income | Fee income growth | Total Score | Digital engagement | Total Score | Operational risk | Quality of book | Improvements in quality of book | Final score | ||||
| Score | Score | Score | Score | Score | Score | Score | 30% | Score | 5% | Score | Score | 15% | Score | Score | Score | Score | 15% | Score | Score | Score | 15% | Score | 5% | Score | Score | Score | 15% | ||||
| 5 | 10 | 5 | 10 | 10 | 10 | 10 | 30.0 | 10 | 5.0 | 10 | 10 | 15.0 | 5 | 10 | 5 | 10 | 15.0 | 10 | 10 | 10 | 15.0 | 5 | 5.0 | 5 | 10 | 10 | 15.0 | ||||
| 1 | Bank of China (Hong Kong) | Hong Kong | 1.0 | 9.0 | 5.0 | 6.0 | 2.0 | 7.0 | 5.0 | 17.5 | 5.0 | 2.5 | 3.6 | 10.0 | 10.2 | 2.0 | 3.0 | 2.0 | 10.0 | 8.5 | 6.5 | 7.0 | 10.0 | 11.8 | 4.8 | 4.8 | 3.0 | 7.0 | 1.0 | 6.6 | 61.9 |
| 2 | Emirates NBD | UAE | 1.0 | 4.0 | 5.0 | 10.0 | 0.0 | 9.0 | 0.0 | 14.5 | 7.0 | 3.5 | 8.4 | 5.0 | 10.1 | 1.0 | 10.0 | 1.0 | 10.0 | 11.0 | 4.6 | 8.0 | 2.0 | 7.3 | 4.7 | 4.7 | 3.0 | 3.0 | 6.0 | 7.2 | 58.3 |
| 3 | First Abu Dhabi Bank | UAE | 1.0 | 6.0 | 5.0 | 7.0 | 3.0 | 8.0 | 1.0 | 15.5 | 6.0 | 3.0 | 8.0 | 1.0 | 6.8 | 1.0 | 8.0 | 2.0 | 9.0 | 10.0 | 3.5 | 8.0 | 10.0 | 10.8 | 4.7 | 4.7 | 4.0 | 3.0 | 4.0 | 6.6 | 57.3 |
| 4 | China Construction Bank | China | 4.0 | 1.0 | 1.0 | 4.0 | 0.0 | 9.0 | 2.0 | 10.5 | 7.0 | 3.5 | 6.8 | 7.0 | 10.4 | 5.0 | 6.0 | 4.0 | 8.0 | 11.5 | 7.5 | 4.0 | 10.0 | 10.8 | 3.9 | 3.9 | 4.0 | 6.0 | 0.0 | 6.0 | 56.5 |
| 5 | JPMorgan Chase | USA | 5.0 | 3.0 | 4.0 | 8.0 | 2.0 | 5.0 | 0.0 | 13.5 | 7.0 | 3.5 | 6.0 | 7.0 | 9.8 | 5.0 | 0.0 | 0.0 | 7.0 | 6.0 | 6.5 | 8.0 | 10.0 | 12.3 | 4.5 | 4.5 | 3.0 | 8.0 | 0.0 | 6.6 | 56.1 |
| 6 | Standard Chartered (Hong Kong) | Hong Kong | 1.0 | 5.0 | 3.0 | 5.0 | 1.0 | 5.0 | 2.0 | 11.0 | 9.0 | 4.5 | 7.5 | 7.0 | 10.9 | 2.0 | 6.0 | 3.0 | 10.0 | 10.5 | 6.7 | 9.0 | 3.0 | 9.4 | 4.3 | 4.3 | 4.0 | 5.0 | 0.0 | 5.4 | 55.9 |
| 7 | DBS | Singapore | 1.0 | 2.0 | 5.0 | 8.0 | 2.0 | 5.0 | 0.0 | 11.5 | 7.0 | 3.5 | 6.5 | 7.0 | 10.1 | 2.0 | 4.0 | 2.0 | 10.0 | 9.0 | 4.0 | 8.0 | 9.0 | 10.5 | 4.5 | 4.5 | 3.0 | 8.0 | 0.0 | 6.6 | 55.7 |
| 8 | China Merchants Bank | China | 2.0 | 1.0 | 1.0 | 6.0 | 2.0 | 8.0 | 0.0 | 10.0 | 9.0 | 4.5 | 3.9 | 10.0 | 10.4 | 4.0 | 6.0 | 5.0 | 10.0 | 12.5 | 7.3 | 6.0 | 0.0 | 6.7 | 4.9 | 4.9 | 3.0 | 7.0 | 0.0 | 6.0 | 55.0 |
| 9 | NatWest | UK | 1.0 | 8.0 | 3.0 | 3.0 | 1.0 | 6.0 | 10.0 | 16.0 | 6.0 | 3.0 | 8.1 | 7.0 | 11.3 | 3.0 | 2.0 | 1.0 | 9.0 | 7.5 | 6.0 | 7.0 | 0.0 | 6.5 | 4.2 | 4.2 | 3.0 | 6.0 | 1.0 | 6.0 | 54.5 |
| 10 | Kuwait Finance House | Kuwait | 1.0 | 4.0 | 5.0 | 7.0 | 3.0 | 7.0 | 3.0 | 15.0 | 6.0 | 3.0 | 7.0 | 7.0 | 10.5 | 1.0 | 0.0 | 2.0 | 8.0 | 5.5 | 2.4 | 4.0 | 10.0 | 8.2 | 4.0 | 4.0 | 4.0 | 5.0 | 4.0 | 7.8 | 54.0 |
| 11 | ABC | China | 4.0 | 0.0 | 2.0 | 3.0 | 0.0 | 9.0 | 0.0 | 9.0 | 8.0 | 4.0 | 1.5 | 10.0 | 8.6 | 5.0 | 7.0 | 4.0 | 7.0 | 11.5 | 7.0 | 4.0 | 10.0 | 10.5 | 4.8 | 4.8 | 3.0 | 6.0 | 0.0 | 5.4 | 53.8 |
| 12 | ING | Global | 2.0 | 0.0 | 2.0 | 2.0 | 0.0 | 5.0 | 0.0 | 5.5 | 10.0 | 5.0 | 8.0 | 7.0 | 11.3 | 4.0 | 4.0 | 1.0 | 10.0 | 9.5 | 9.0 | 7.0 | 6.0 | 11.0 | 4.8 | 4.8 | 4.0 | 5.0 | 2.0 | 6.6 | 53.7 |
| 13 | CTBC Bank | Taiwan | 1.0 | 5.0 | 4.0 | 4.0 | 0.0 | 5.0 | 4.0 | 11.5 | 7.0 | 3.5 | 7.1 | 5.0 | 9.1 | 1.0 | 4.0 | 3.0 | 9.0 | 8.5 | 6.0 | 10.0 | 1.0 | 8.5 | 4.7 | 4.7 | 3.0 | 10.0 | 0.0 | 7.8 | 53.6 |
| 14 | Royal Bank of Canada | Canada | 2.0 | 10.0 | 3.0 | 4.0 | 1.0 | 7.0 | 2.0 | 14.5 | 7.0 | 3.5 | 6.3 | 7.0 | 10.0 | 3.0 | 2.0 | 4.0 | 9.0 | 9.0 | 4.5 | 6.0 | 0.0 | 5.3 | 4.3 | 4.3 | 4.0 | 7.0 | 0.0 | 6.6 | 53.1 |
| 15 | OCBC Bank | Singapore | 1.0 | 1.0 | 4.0 | 3.0 | 0.0 | 5.0 | 0.0 | 7.0 | 6.0 | 3.0 | 5.2 | 7.0 | 9.2 | 2.0 | 7.0 | 2.0 | 9.0 | 10.0 | 4.0 | 10.0 | 9.0 | 11.5 | 4.6 | 4.6 | 4.0 | 8.0 | 1.0 | 7.8 | 53.1 |
| 16 | BPI | Philippines | 1.0 | 9.0 | 5.0 | 8.0 | 1.0 | 5.0 | 6.0 | 17.5 | 10.0 | 5.0 | 2.7 | 10.0 | 9.5 | 1.0 | 1.0 | 5.0 | 10.0 | 8.5 | 1.2 | 6.0 | 3.0 | 5.1 | 4.8 | 4.8 | 3.0 | 0.0 | 1.0 | 2.4 | 52.8 |
| 17 | Rabobank | Netherlands | 1.0 | 0.0 | 5.0 | 4.0 | 0.0 | 6.0 | 0.0 | 8.0 | 9.0 | 4.5 | 7.0 | 7.0 | 10.5 | 3.0 | 4.0 | 2.0 | 8.0 | 8.5 | 5.0 | 5.0 | 7.0 | 8.5 | 4.1 | 4.1 | 4.0 | 9.0 | 1.0 | 8.4 | 52.5 |
| 18 | E.Sun Bank | Taiwan | 1.0 | 3.0 | 4.0 | 3.0 | 1.0 | 6.0 | 0.0 | 9.0 | 8.0 | 4.0 | 6.2 | 7.0 | 9.9 | 1.0 | 4.0 | 2.0 | 10.0 | 8.5 | 5.5 | 10.0 | 1.0 | 8.3 | 5.0 | 5.0 | 3.0 | 10.0 | 0.0 | 7.8 | 52.5 |
| 19 | State Bank of India | India | 2.0 | 6.0 | 5.0 | 4.0 | 0.0 | 3.0 | 1.0 | 10.5 | 6.0 | 3.0 | 6.0 | 5.0 | 8.3 | 2.0 | 7.0 | 4.0 | 7.0 | 10.0 | 4.0 | 8.0 | 10.0 | 11.0 | 4.5 | 4.5 | 3.0 | 4.0 | 1.0 | 4.8 | 52.1 |
| 20 | Bank of Beijing | China | 1.0 | 0.0 | 3.0 | 2.0 | 0.0 | 10.0 | 0.0 | 8.0 | 6.0 | 3.0 | 6.0 | 7.0 | 9.8 | 1.0 | 7.0 | 5.0 | 5.0 | 9.0 | 9.7 | 2.0 | 10.0 | 10.9 | 4.0 | 4.0 | 3.0 | 7.0 | 2.0 | 7.2 | 51.8 |
| 21 | Bank of China | China | 3.0 | 0.0 | 2.0 | 3.0 | 1.0 | 7.0 | 0.0 | 8.0 | 6.0 | 3.0 | 1.2 | 10.0 | 8.4 | 5.0 | 6.0 | 4.0 | 8.0 | 11.5 | 7.0 | 4.0 | 10.0 | 10.5 | 3.1 | 3.1 | 3.0 | 8.0 | 1.0 | 7.2 | 51.7 |
| 22 | HSBC | Global | 1.0 | 4.0 | 2.0 | 2.0 | 0.0 | 3.0 | 3.0 | 7.5 | 4.0 | 2.0 | 7.5 | 10.0 | 13.1 | 4.0 | 2.0 | 0.0 | 10.0 | 8.0 | 4.9 | 10.0 | 7.0 | 11.0 | 4.8 | 4.8 | 3.0 | 4.0 | 1.0 | 4.8 | 51.2 |
| 23 | Ping An Bank | China | 1.0 | 0.0 | 0.0 | 1.0 | 1.0 | 7.0 | 0.0 | 5.0 | 7.0 | 3.5 | 3.1 | 10.0 | 9.8 | 2.0 | 3.0 | 5.0 | 6.0 | 8.0 | 9.0 | 7.0 | 10.0 | 13.0 | 4.9 | 4.9 | 4.0 | 6.0 | 1.0 | 6.6 | 50.8 |
| 24 | Bank of Montreal | Canada | 2.0 | 4.0 | 4.0 | 3.0 | 0.0 | 6.0 | 2.0 | 10.5 | 10.0 | 5.0 | 6.5 | 7.0 | 10.1 | 2.0 | 1.0 | 4.0 | 10.0 | 8.5 | 3.7 | 7.0 | 0.0 | 5.4 | 4.5 | 4.5 | 4.0 | 7.0 | 0.0 | 6.6 | 50.6 |
| 25 | ICBC | China | 4.0 | 0.0 | 0.0 | 4.0 | 4.0 | 7.0 | 0.0 | 9.5 | 6.0 | 3.0 | 2.3 | 10.0 | 9.2 | 5.0 | 7.0 | 4.0 | 7.0 | 11.5 | 7.9 | 4.0 | 1.0 | 6.5 | 4.9 | 4.9 | 4.0 | 6.0 | 0.0 | 6.0 | 50.6 |
| 26 | UOB | Singapore | 1.0 | 0.0 | 5.0 | 4.0 | 0.0 | 5.0 | 4.0 | 9.5 | 6.0 | 3.0 | 4.8 | 7.0 | 8.9 | 2.0 | 2.0 | 2.0 | 10.0 | 8.0 | 4.0 | 9.0 | 8.0 | 10.5 | 4.7 | 4.7 | 4.0 | 6.0 | 0.0 | 6.0 | 50.6 |
| 27 | HDFC Bank | India | 3.0 | 5.0 | 5.0 | 4.0 | 0.0 | 5.0 | 1.0 | 11.5 | 10.0 | 5.0 | 8.0 | 5.0 | 9.8 | 2.0 | 5.0 | 5.0 | 7.0 | 9.5 | 4.0 | 5.0 | 3.0 | 6.0 | 4.0 | 4.0 | 3.0 | 4.0 | 1.0 | 4.8 | 50.6 |
| 28 | Bank Mandiri | Indonesia | 1.0 | 1.0 | 3.0 | 10.0 | 0.0 | 6.0 | 0.0 | 10.5 | 7.0 | 3.5 | 8.8 | 7.0 | 11.9 | 1.0 | 9.0 | 3.0 | 10.0 | 11.5 | 1.5 | 5.0 | 0.0 | 3.3 | 4.1 | 4.1 | 3.0 | 6.0 | 0.0 | 5.4 | 50.1 |
| 29 | Al Rajhi Bank | Saudi Arabia | 1.0 | 0.0 | 3.0 | 4.0 | 0.0 | 6.0 | 0.0 | 7.0 | 8.0 | 4.0 | 8.0 | 7.0 | 11.3 | 1.0 | 6.0 | 1.0 | 10.0 | 9.0 | 2.4 | 4.0 | 8.0 | 7.2 | 4.4 | 4.4 | 4.0 | 8.0 | 0.0 | 7.2 | 50.1 |
| 30 | Lloyds Banking Group | UK | 2.0 | 7.0 | 1.0 | 3.0 | 1.0 | 3.0 | 7.0 | 12.0 | 9.0 | 4.5 | 8.4 | 7.0 | 11.6 | 3.0 | 2.0 | 0.0 | 6.0 | 5.5 | 6.0 | 5.0 | 0.0 | 5.5 | 4.4 | 4.4 | 4.0 | 5.0 | 2.0 | 6.6 | 50.1 |
| 31 | Itaú Unibanco | Brazil | 2.0 | 6.0 | 3.0 | 3.0 | 2.0 | 6.0 | 2.0 | 12.0 | 10.0 | 5.0 | 7.3 | 7.0 | 10.7 | 2.0 | 0.0 | 4.0 | 5.0 | 5.5 | 6.5 | 7.0 | 0.0 | 6.8 | 4.6 | 4.6 | 4.0 | 2.0 | 3.0 | 5.4 | 50.0 |
| 32 | Banco Bradesco | Brazil | 1.0 | 7.0 | 2.0 | 3.0 | 1.0 | 6.0 | 4.0 | 12.0 | 10.0 | 5.0 | 6.7 | 7.0 | 10.3 | 2.0 | 3.0 | 2.0 | 4.0 | 5.5 | 6.1 | 7.0 | 0.0 | 6.6 | 4.6 | 4.6 | 3.0 | 0.0 | 7.0 | 6.0 | 49.9 |
| 33 | Hongkong and Shanghai Banking Corporation | Hong Kong | 1.0 | 0.0 | 4.0 | 3.0 | 0.0 | 2.0 | 0.0 | 5.0 | 7.0 | 3.5 | 4.0 | 10.0 | 10.5 | 3.0 | 0.0 | 0.0 | 10.0 | 6.5 | 6.5 | 7.0 | 10.0 | 11.8 | 4.8 | 4.8 | 4.0 | 8.0 | 1.0 | 7.8 | 49.9 |
| 34 | Standard Chartered | Global | 1.0 | 4.0 | 3.0 | 4.0 | 2.0 | 4.0 | 1.0 | 9.5 | 6.0 | 3.0 | 6.5 | 7.0 | 10.1 | 2.0 | 9.0 | 2.0 | 9.0 | 11.0 | 5.6 | 6.0 | 0.0 | 5.8 | 4.6 | 4.6 | 3.0 | 4.0 | 2.0 | 5.4 | 49.4 |
| 35 | ICICI Bank | India | 2.0 | 4.0 | 5.0 | 6.0 | 0.0 | 5.0 | 1.0 | 11.5 | 9.0 | 4.5 | 7.5 | 5.0 | 9.4 | 2.0 | 5.0 | 3.0 | 7.0 | 8.5 | 4.0 | 4.0 | 3.0 | 5.5 | 4.6 | 4.6 | 4.0 | 4.0 | 1.0 | 5.4 | 49.4 |
| 36 | Bank of East Asia | Hong Kong | 1.0 | 0.0 | 5.0 | 8.0 | 1.0 | 9.0 | 0.0 | 12.0 | 5.0 | 2.5 | 3.4 | 10.0 | 10.1 | 1.0 | 1.0 | 1.0 | 10.0 | 6.5 | 4.0 | 6.0 | 10.0 | 10.0 | 4.6 | 4.6 | 3.0 | 3.0 | 0.0 | 3.6 | 49.3 |
| 37 | CaixaBank | Spain | 2.0 | 2.0 | 4.0 | 3.0 | 1.0 | 6.0 | 2.0 | 10.0 | 8.0 | 4.0 | 6.5 | 5.0 | 8.3 | 4.0 | 3.0 | 0.0 | 10.0 | 8.5 | 7.5 | 5.0 | 2.0 | 7.3 | 4.7 | 4.7 | 4.0 | 4.0 | 2.0 | 6.0 | 49.1 |
| 38 | Deutsche Bank | Germany | 1.0 | 2.0 | 2.0 | 2.0 | 2.0 | 3.0 | 9.0 | 10.5 | 5.0 | 2.5 | 8.3 | 10.0 | 13.9 | 3.0 | 1.0 | 0.0 | 8.0 | 6.0 | 5.7 | 8.0 | 1.0 | 7.5 | 4.5 | 4.5 | 3.0 | 3.0 | 0.0 | 4.2 | 49.1 |
| 39 | Canadian Imperial Bank of Commerce | Canada | 1.0 | 5.0 | 3.0 | 3.0 | 1.0 | 5.0 | 2.0 | 10.0 | 7.0 | 3.5 | 6.7 | 7.0 | 10.3 | 2.0 | 3.0 | 2.0 | 10.0 | 8.5 | 4.0 | 7.0 | 0.0 | 5.5 | 3.9 | 3.9 | 4.0 | 8.0 | 0.0 | 7.2 | 48.9 |
| 40 | Commerzbank | Germany | 1.0 | 7.0 | 3.0 | 3.0 | 1.0 | 4.0 | 4.0 | 11.5 | 9.0 | 4.5 | 6.5 | 7.0 | 10.1 | 2.0 | 0.0 | 2.0 | 6.0 | 5.0 | 5.0 | 10.0 | 0.0 | 7.5 | 4.8 | 4.8 | 3.0 | 5.0 | 1.0 | 5.4 | 48.8 |
| 41 | Bank of America | USA | 3.0 | 3.0 | 2.0 | 3.0 | 2.0 | 5.0 | 1.0 | 9.5 | 7.0 | 3.5 | 5.7 | 7.0 | 9.5 | 4.0 | 1.0 | 0.0 | 10.0 | 7.5 | 9.0 | 5.0 | 0.0 | 7.0 | 4.4 | 4.4 | 3.0 | 8.0 | 1.0 | 7.2 | 48.6 |
| 42 | BBVA | Spain | 2.0 | 5.0 | 5.0 | 3.0 | 2.0 | 8.0 | 6.0 | 15.5 | 4.0 | 2.0 | 5.5 | 7.0 | 9.4 | 2.0 | 1.0 | 1.0 | 10.0 | 7.0 | 6.3 | 6.0 | 0.0 | 6.2 | 4.4 | 4.4 | 3.0 | 2.0 | 2.0 | 4.2 | 48.6 |
| 43 | Qatar Islamic Bank | Qatar | 1.0 | 10.0 | 1.0 | 10.0 | 6.0 | 10.0 | 1.0 | 19.5 | 6.0 | 3.0 | 8.3 | 1.0 | 7.0 | 1.0 | 4.0 | 2.0 | 5.0 | 6.0 | 3.0 | 4.0 | 0.0 | 3.5 | 3.6 | 3.6 | 4.0 | 6.0 | 0.0 | 6.0 | 48.6 |
| 44 | Mashreq | UAE | 1.0 | 0.0 | 5.0 | 5.0 | 0.0 | 6.0 | 0.0 | 8.5 | 6.0 | 3.0 | 8.5 | 1.0 | 7.1 | 1.0 | 9.0 | 4.0 | 10.0 | 12.0 | 4.0 | 9.0 | 1.0 | 7.0 | 4.8 | 4.8 | 4.0 | 2.0 | 3.0 | 5.4 | 47.8 |
| 45 | Saudi National Bank | Saudi Arabia | 1.0 | 0.0 | 3.0 | 5.0 | 1.0 | 7.0 | 1.0 | 9.0 | 7.0 | 3.5 | 7.5 | 7.0 | 10.9 | 1.0 | 2.0 | 1.0 | 10.0 | 7.0 | 2.4 | 2.0 | 5.0 | 4.7 | 4.9 | 4.9 | 3.0 | 8.0 | 2.0 | 7.8 | 47.8 |
| 46 | Danske Bank | Denmark | 1.0 | 0.0 | 4.0 | 2.0 | 0.0 | 5.0 | 0.0 | 6.0 | 5.0 | 2.5 | 8.0 | 7.0 | 11.3 | 1.0 | 2.0 | 1.0 | 10.0 | 7.0 | 6.5 | 7.0 | 7.0 | 10.3 | 4.6 | 4.6 | 4.0 | 5.0 | 1.0 | 6.0 | 47.6 |
| 47 | Wells Fargo | USA | 3.0 | 1.0 | 1.0 | 5.0 | 0.0 | 3.0 | 1.0 | 7.0 | 7.0 | 3.5 | 5.4 | 7.0 | 9.3 | 4.0 | 1.0 | 0.0 | 10.0 | 7.5 | 6.0 | 9.0 | 0.0 | 7.5 | 4.8 | 4.8 | 1.0 | 7.0 | 5.0 | 7.8 | 47.4 |
| 48 | Nedbank | South Africa | 1.0 | 1.0 | 3.0 | 1.0 | 1.0 | 4.0 | 0.0 | 5.5 | 9.0 | 4.5 | 4.2 | 7.0 | 8.4 | 1.0 | 4.0 | 2.0 | 10.0 | 8.5 | 7.0 | 9.0 | 3.0 | 9.5 | 4.4 | 4.4 | 4.0 | 4.0 | 3.0 | 6.6 | 47.4 |
| 49 | BIDV | Vietnam | 1.0 | 2.0 | 5.0 | 3.5 | 0.0 | 7.0 | 0.0 | 9.3 | 8.0 | 4.0 | 6.6 | 7.0 | 10.2 | 1.0 | 5.0 | 3.0 | 4.3 | 6.7 | 4.5 | 2.0 | 6.0 | 6.3 | 3.4 | 3.4 | 3.0 | 7.0 | 2.5 | 7.5 | 47.4 |
| 50 | Commonwealth Bank of Australia | Australia | 1.0 | 1.0 | 2.0 | 3.0 | 1.0 | 7.0 | 0.0 | 7.5 | 7.0 | 3.5 | 7.5 | 10.0 | 13.1 | 2.0 | 3.0 | 3.0 | 10.0 | 9.0 | 5.0 | 3.0 | 1.0 | 4.5 | 4.3 | 4.3 | 3.0 | 6.0 | 0.0 | 5.4 | 47.3 |
| 51 | First National Bank (FirstRand) | South Africa | 1.0 | 2.0 | 1.0 | 7.0 | 6.0 | 5.0 | 8.0 | 15.0 | 6.0 | 3.0 | 4.0 | 5.0 | 6.8 | 1.0 | 4.0 | 3.0 | 6.0 | 7.0 | 5.0 | 10.0 | 2.0 | 8.5 | 4.6 | 4.6 | 4.0 | 0.0 | 0.0 | 2.4 | 47.3 |
| 52 | Scotiabank | Canada | 2.0 | 1.0 | 2.0 | 3.0 | 0.0 | 6.0 | 0.0 | 7.0 | 10.0 | 5.0 | 6.5 | 7.0 | 10.1 | 2.0 | 2.0 | 2.0 | 9.0 | 7.5 | 3.8 | 9.0 | 0.0 | 6.4 | 4.6 | 4.6 | 4.0 | 7.0 | 0.0 | 6.6 | 47.2 |
| 53 | Techcombank | Vietnam | 1.0 | 6.0 | 5.0 | 6.0 | 1.0 | 4.0 | 0.0 | 11.5 | 6.0 | 3.0 | 8.2 | 7.0 | 11.4 | 1.0 | 8.0 | 5.0 | 3.0 | 7.0 | 1.4 | 4.0 | 8.0 | 6.7 | 3.9 | 3.9 | 1.0 | 4.0 | 1.0 | 3.6 | 47.1 |
| 54 | HNB | Sri Lanka | 1.0 | 0.0 | 5.0 | 6.0 | 3.0 | 5.0 | 0.0 | 10.0 | 5.0 | 2.5 | 7.9 | 3.0 | 8.2 | 1.0 | 8.0 | 5.0 | 6.0 | 10.0 | 9.0 | 3.0 | 0.0 | 6.0 | 3.8 | 3.8 | 4.0 | 2.0 | 5.0 | 6.6 | 47.1 |
| 55 | Axis Bank | India | 2.0 | 10.0 | 5.0 | 4.0 | 0.0 | 5.0 | 1.0 | 13.5 | 7.0 | 3.5 | 5.5 | 1.0 | 4.9 | 1.0 | 6.0 | 5.0 | 8.0 | 10.0 | 3.0 | 7.0 | 0.0 | 5.0 | 4.6 | 4.6 | 4.0 | 4.0 | 1.0 | 5.4 | 46.9 |
| 56 | Jyske Bank | Denmark | 1.0 | 0.0 | 4.0 | 2.0 | 1.0 | 3.0 | 6.0 | 8.5 | 6.0 | 3.0 | 6.5 | 7.0 | 10.1 | 1.0 | 0.0 | 3.0 | 10.0 | 7.0 | 5.0 | 5.0 | 10.0 | 10.0 | 2.8 | 2.8 | 3.0 | 5.0 | 1.0 | 5.4 | 46.8 |
| 57 | Vietcombank | Vietnam | 1.0 | 5.0 | 3.0 | 4.0 | 0.0 | 6.0 | 1.0 | 10.0 | 7.0 | 3.5 | 5.4 | 7.0 | 9.3 | 1.0 | 5.0 | 4.0 | 4.0 | 7.0 | 2.7 | 2.0 | 6.0 | 5.4 | 3.6 | 3.6 | 3.0 | 8.0 | 2.4 | 8.0 | 46.8 |
| 58 | DNB Bank | Norway | 1.0 | 3.0 | 5.0 | 4.0 | 1.0 | 7.0 | 3.0 | 12.0 | 6.0 | 3.0 | 4.5 | 5.0 | 7.1 | 1.0 | 4.0 | 2.0 | 4.0 | 5.5 | 3.0 | 5.0 | 10.0 | 9.0 | 4.1 | 4.1 | 3.0 | 6.0 | 1.0 | 6.0 | 46.7 |
| 59 | Kotak Mahindra Bank | India | 1.0 | 10.0 | 5.0 | 3.0 | 0.0 | 5.0 | 1.0 | 12.5 | 5.0 | 2.5 | 5.0 | 3.0 | 6.0 | 1.0 | 9.0 | 5.0 | 9.0 | 12.0 | 2.5 | 5.0 | 0.0 | 3.8 | 4.4 | 4.4 | 4.0 | 4.0 | 1.0 | 5.4 | 46.6 |
| 60 | National Bank of Egypt | Egypt | 1.0 | 10.0 | 5.0 | 4.0 | 2.0 | 6.0 | 4.0 | 16.0 | 7.0 | 3.5 | 4.0 | 1.0 | 3.8 | 1.0 | 10.0 | 5.0 | 6.0 | 11.0 | 2.0 | 6.0 | 0.0 | 4.0 | 4.0 | 4.0 | 3.0 | 3.0 | 1.0 | 4.2 | 46.5 |
| 61 | Commercial Bank of Ceylon | Sri Lanka | 1.0 | 10.0 | 5.0 | 7.0 | 0.0 | 7.0 | 0.0 | 15.0 | 7.0 | 3.5 | 6.0 | 1.0 | 5.3 | 1.0 | 8.0 | 4.0 | 6.0 | 9.5 | 4.0 | 5.0 | 1.0 | 5.0 | 2.1 | 2.1 | 3.0 | 2.0 | 5.0 | 6.0 | 46.4 |
| 62 | KB Kookmin Bank | South Korea | 1.0 | 0.0 | 4.0 | 3.0 | 0.0 | 6.0 | 0.0 | 7.0 | 5.0 | 2.5 | 4.0 | 10.0 | 10.5 | 2.0 | 2.0 | 2.0 | 7.0 | 6.5 | 7.2 | 4.0 | 1.0 | 6.1 | 4.6 | 4.6 | 4.0 | 10.0 | 1.0 | 9.0 | 46.2 |
| 63 | MUFG Bank | Japan | 1.0 | 8.0 | 2.0 | 2.0 | 2.0 | 3.0 | 3.0 | 10.5 | 5.0 | 2.5 | 1.8 | 5.0 | 5.1 | 4.0 | 1.0 | 1.0 | 6.0 | 6.0 | 4.5 | 10.0 | 10.0 | 12.3 | 3.1 | 3.1 | 3.0 | 5.0 | 3.0 | 6.6 | 46.1 |
| 64 | China CITIC | China | 1.0 | 0.0 | 1.0 | 1.0 | 1.0 | 8.0 | 1.0 | 6.5 | 6.0 | 3.0 | 2.5 | 10.0 | 9.4 | 1.0 | 7.0 | 5.0 | 8.0 | 10.5 | 7.0 | 6.0 | 2.0 | 7.5 | 3.1 | 3.1 | 3.0 | 6.0 | 1.0 | 6.0 | 46.0 |
| 65 | GCB Bank | Ghana | 1.0 | 10.0 | 5.0 | 5.0 | 1.0 | 6.0 | 4.0 | 16.0 | 7.0 | 3.5 | 1.5 | 1.0 | 1.9 | 1.0 | 10.0 | 5.0 | 6.0 | 11.0 | 0.5 | 5.0 | 4.0 | 4.8 | 2.6 | 2.6 | 3.0 | 0.0 | 7.0 | 6.0 | 45.7 |
| 66 | Shinhan Bank | South Korea | 1.0 | 1.0 | 5.0 | 2.0 | 1.0 | 6.0 | 1.0 | 8.5 | 7.0 | 3.5 | 3.7 | 10.0 | 10.3 | 2.0 | 2.0 | 1.0 | 6.0 | 5.5 | 6.0 | 4.0 | 1.0 | 5.5 | 3.7 | 3.7 | 3.0 | 10.0 | 1.0 | 8.4 | 45.4 |
| 67 | CIMB | Malaysia | 1.0 | 3.0 | 3.0 | 3.0 | 1.0 | 4.0 | 0.0 | 7.5 | 6.0 | 3.0 | 8.0 | 7.0 | 11.3 | 1.0 | 3.0 | 2.0 | 10.0 | 8.0 | 1.5 | 5.0 | 3.0 | 4.8 | 4.8 | 4.8 | 3.0 | 4.0 | 3.0 | 6.0 | 45.3 |
| 68 | Maybank | Malaysia | 1.0 | 1.0 | 3.0 | 2.0 | 0.0 | 4.0 | 3.0 | 7.0 | 7.0 | 3.5 | 4.6 | 7.0 | 8.7 | 1.0 | 6.0 | 2.0 | 9.0 | 9.0 | 2.0 | 5.0 | 2.0 | 4.5 | 3.3 | 3.3 | 3.0 | 7.0 | 5.0 | 9.0 | 45.0 |
| 69 | Mizuho Bank | Japan | 1.0 | 9.0 | 2.0 | 2.0 | 1.0 | 1.0 | 10.0 | 13.0 | 6.0 | 3.0 | 1.5 | 5.0 | 4.9 | 3.0 | 2.0 | 2.0 | 5.0 | 6.0 | 3.0 | 10.0 | 1.0 | 7.0 | 3.3 | 3.3 | 3.0 | 6.0 | 4.0 | 7.8 | 45.0 |
| 70 | Hong Leong Bank Berhad | Malaysia | 1.0 | 4.0 | 2.0 | 3.0 | 0.0 | 9.0 | 0.0 | 9.5 | 9.0 | 4.5 | 5.0 | 7.0 | 9.0 | 1.0 | 3.0 | 2.0 | 6.0 | 6.0 | 2.0 | 5.0 | 0.0 | 3.5 | 4.9 | 4.9 | 3.0 | 8.0 | 1.0 | 7.2 | 44.6 |
| 71 | Bank of Communications | China | 1.0 | 0.0 | 0.0 | 1.0 | 0.0 | 6.0 | 0.0 | 4.0 | 6.0 | 3.0 | 1.2 | 10.0 | 8.4 | 3.0 | 6.0 | 5.0 | 6.0 | 10.0 | 9.0 | 6.0 | 3.0 | 9.0 | 4.8 | 4.8 | 3.0 | 6.0 | 0.0 | 5.4 | 44.6 |
| 72 | Commercial International Bank Egypt | Egypt | 1.0 | 10.0 | 5.0 | 4.0 | 2.0 | 8.0 | 0.0 | 15.0 | 4.0 | 2.0 | 4.5 | 1.0 | 4.1 | 1.0 | 10.0 | 5.0 | 10.0 | 13.0 | 1.5 | 6.0 | 0.0 | 3.8 | 2.5 | 2.5 | 3.0 | 3.0 | 1.0 | 4.2 | 44.6 |
| 73 | Westpac Banking Corporation | Australia | 1.0 | 2.0 | 0.0 | 2.0 | 1.0 | 4.0 | 1.0 | 5.5 | 6.0 | 3.0 | 7.1 | 7.0 | 10.6 | 2.0 | 10.0 | 5.0 | 4.0 | 10.5 | 5.0 | 4.0 | 0.0 | 4.5 | 4.2 | 4.2 | 3.0 | 6.0 | 1.0 | 6.0 | 44.3 |
| 74 | Union Bank of the Philippines | Philippines | 1.0 | 5.0 | 5.0 | 5.0 | 0.0 | 3.0 | 0.0 | 9.5 | 10.0 | 5.0 | 6.0 | 7.0 | 9.8 | 1.0 | 0.0 | 2.0 | 10.0 | 6.5 | 2.0 | 10.0 | 0.0 | 6.0 | 4.8 | 4.8 | 3.0 | 0.0 | 1.0 | 2.4 | 44.0 |
| 75 | Hang Seng Bank | Hongkong | 1.0 | 0.0 | 3.0 | 5.0 | 1.0 | 8.0 | 7.0 | 12.5 | 9.0 | 4.5 | 5.4 | 7.0 | 9.3 | 1.0 | 1.0 | 1.0 | 10.0 | 6.5 | 6.0 | 6.0 | 0.0 | 6.0 | 2.3 | 2.3 | 3.0 | 0.0 | 1.0 | 2.4 | 43.5 |
| 76 | OP Pohjola | Finland | 1.0 | 0.0 | 5.0 | 2.0 | 0.0 | 3.0 | 0.0 | 5.5 | 10.0 | 5.0 | 4.5 | 7.0 | 8.6 | 1.0 | 2.0 | 1.0 | 6.0 | 5.0 | 6.0 | 5.0 | 8.0 | 9.5 | 3.8 | 3.8 | 3.0 | 3.0 | 4.0 | 6.0 | 43.4 |
| 77 | Absa | South Africa | 1.0 | 2.0 | 3.0 | 3.0 | 0.0 | 4.0 | 0.0 | 6.5 | 10.0 | 5.0 | 3.1 | 7.0 | 7.6 | 1.0 | 5.0 | 3.0 | 10.0 | 9.5 | 5.0 | 7.0 | 2.0 | 7.0 | 4.8 | 4.8 | 3.0 | 0.0 | 2.0 | 3.0 | 43.4 |
| 78 | Kasikornbank | Thailand | 1.0 | 0.0 | 2.0 | 3.0 | 2.0 | 6.0 | 2.0 | 8.0 | 5.0 | 2.5 | 7.4 | 7.0 | 10.8 | 1.0 | 1.0 | 1.0 | 10.0 | 6.5 | 4.9 | 7.0 | 2.0 | 7.0 | 4.3 | 4.3 | 3.0 | 1.0 | 3.0 | 4.2 | 43.3 |
| 79 | RCBC | Philippines | 1.0 | 8.0 | 5.0 | 8.0 | 0.0 | 7.0 | 3.0 | 16.0 | 3.0 | 1.5 | 6.7 | 7.0 | 10.3 | 1.0 | 1.0 | 4.0 | 10.0 | 8.0 | 1.3 | 5.0 | 1.0 | 3.7 | 2.0 | 2.0 | 3.0 | 0.0 | 0.0 | 1.8 | 43.2 |
| 80 | First Bank of Nigeria | Nigeria | 1.0 | 7.0 | 5.0 | 5.0 | 1.0 | 5.0 | 1.0 | 12.5 | 4.0 | 2.0 | 3.5 | 7.0 | 7.9 | 1.0 | 5.0 | 5.0 | 10.0 | 10.5 | 8.0 | 1.0 | 1.0 | 5.0 | 3.5 | 3.5 | 3.0 | 0.0 | 0.0 | 1.8 | 43.2 |
| 81 | Postal Savings Bank of China | China | 3.0 | 0.0 | 1.0 | 1.0 | 0.0 | 3.0 | 0.0 | 4.0 | 10.0 | 5.0 | 1.3 | 10.0 | 8.5 | 5.0 | 5.0 | 3.0 | 4.0 | 8.5 | 9.0 | 2.0 | 2.0 | 6.5 | 4.6 | 4.6 | 3.0 | 6.0 | 0.0 | 5.4 | 42.5 |
| 82 | Siam Commercial Bank | Thailand | 1.0 | 0.0 | 1.0 | 7.0 | 1.0 | 6.0 | 1.0 | 8.5 | 7.0 | 3.5 | 8.1 | 7.0 | 11.3 | 1.0 | 1.0 | 0.0 | 10.0 | 6.0 | 1.5 | 7.0 | 1.0 | 4.8 | 4.2 | 4.2 | 3.0 | 3.0 | 1.0 | 4.2 | 42.5 |
| 83 | Citigroup | Global | 2.0 | 2.0 | 3.0 | 3.0 | 4.0 | 6.0 | 3.0 | 11.5 | 4.0 | 2.0 | 3.9 | 7.0 | 8.2 | 1.0 | 0.0 | 0.0 | 10.0 | 5.5 | 6.5 | 0.0 | 0.0 | 3.3 | 4.2 | 4.2 | 4.0 | 9.0 | 0.0 | 7.8 | 42.4 |
| 84 | Nordea Bank | Finland | 1.0 | 0.0 | 3.0 | 2.0 | 0.0 | 6.0 | 0.0 | 6.0 | 6.0 | 3.0 | 3.5 | 7.0 | 7.9 | 1.0 | 4.0 | 1.0 | 5.0 | 5.5 | 5.0 | 9.0 | 4.0 | 9.0 | 4.4 | 4.4 | 3.0 | 8.0 | 0.0 | 6.6 | 42.4 |
| 85 | National Australia Bank | Australia | 1.0 | 0.0 | 1.0 | 2.0 | 0.0 | 4.0 | 0.0 | 4.0 | 4.0 | 2.0 | 6.4 | 10.0 | 12.3 | 2.0 | 10.0 | 5.0 | 2.0 | 9.5 | 5.0 | 4.0 | 0.0 | 4.5 | 4.3 | 4.3 | 3.0 | 6.0 | 0.0 | 5.4 | 42.0 |
| 86 | Public Bank Berhad | Malaysia | 1.0 | 1.0 | 3.0 | 3.0 | 1.0 | 7.0 | 0.0 | 8.0 | 8.0 | 4.0 | 4.5 | 7.0 | 8.6 | 1.0 | 1.0 | 1.0 | 8.0 | 5.5 | 1.5 | 5.0 | 0.0 | 3.3 | 4.0 | 4.0 | 5.0 | 8.0 | 1.0 | 8.4 | 41.8 |
| 87 | BNP Paribas | France | 2.0 | 1.0 | 1.0 | 2.0 | 0.0 | 3.0 | 1.0 | 5.0 | 9.0 | 4.5 | 3.5 | 7.0 | 7.9 | 4.0 | 1.0 | 2.0 | 10.0 | 8.5 | 4.7 | 9.0 | 1.0 | 7.4 | 4.1 | 4.1 | 4.0 | 3.0 | 0.0 | 4.2 | 41.5 |
| 88 | Bank Muscat | Oman | 1.0 | 2.0 | 1.0 | 5.0 | 0.0 | 4.0 | 0.0 | 6.5 | 7.0 | 3.5 | 6.0 | 7.0 | 9.8 | 1.0 | 3.0 | 1.0 | 10.0 | 7.5 | 3.0 | 6.0 | 4.0 | 6.5 | 3.9 | 3.9 | 4.0 | 1.0 | 1.0 | 3.6 | 41.3 |
| 89 | Société Générale | France | 1.0 | 6.0 | 0.0 | 2.0 | 2.0 | 3.0 | 5.0 | 9.5 | 5.0 | 2.5 | 2.9 | 5.0 | 5.9 | 2.0 | 0.0 | 0.0 | 10.0 | 6.0 | 2.5 | 10.0 | 5.0 | 8.8 | 4.2 | 4.2 | 3.0 | 3.0 | 1.0 | 4.2 | 41.1 |
| 90 | RHB | Malaysia | 1.0 | 1.0 | 2.0 | 3.0 | 0.0 | 5.0 | 0.0 | 6.0 | 8.0 | 4.0 | 6.5 | 7.0 | 10.1 | 1.0 | 4.0 | 3.0 | 5.0 | 6.5 | 2.5 | 3.0 | 0.0 | 2.8 | 4.8 | 4.8 | 4.0 | 5.0 | 2.0 | 6.6 | 40.8 |
| 91 | Bank Dhofar | Oman | 1.0 | 8.0 | 0.0 | 2.0 | 4.0 | 2.0 | 10.0 | 13.5 | 5.0 | 2.5 | 3.0 | 3.0 | 4.5 | 1.0 | 10.0 | 1.0 | 6.0 | 9.0 | 1.0 | 4.0 | 4.0 | 4.5 | 4.8 | 4.8 | 3.0 | 0.0 | 0.0 | 1.8 | 40.6 |
| 92 | Barclays | UK | 2.0 | 5.0 | 0.0 | 3.0 | 1.0 | 5.0 | 1.0 | 8.5 | 7.0 | 3.5 | 8.0 | 7.0 | 11.3 | 3.0 | 1.0 | 0.0 | 4.0 | 4.0 | 5.5 | 4.0 | 0.0 | 4.8 | 4.2 | 4.2 | 3.0 | 3.0 | 0.0 | 3.6 | 39.8 |
| 93 | SMBC | Japan | 1.0 | 5.0 | 2.0 | 3.0 | 1.0 | 2.0 | 7.0 | 10.5 | 5.0 | 2.5 | 2.0 | 5.0 | 5.3 | 3.0 | 1.0 | 1.0 | 6.0 | 5.5 | 4.0 | 10.0 | 0.0 | 7.0 | 2.9 | 2.9 | 3.0 | 6.0 | 1.0 | 6.0 | 39.7 |
| 94 | Baiduri Bank | Brunei | 1.0 | 0.0 | 3.0 | 1.0 | 0.0 | 0.0 | 0.0 | 2.5 | 8.0 | 4.0 | 9.0 | 7.0 | 12.0 | 1.0 | 0.0 | 1.0 | 10.0 | 6.0 | 3.7 | 3.0 | 10.0 | 8.4 | 1.4 | 1.4 | 3.0 | 6.0 | 0.0 | 5.4 | 39.6 |
| 95 | Toronto-Dominion Bank | Canada | 2.0 | 0.0 | 0.0 | 2.0 | 1.0 | 4.0 | 0.0 | 4.5 | 5.0 | 2.5 | 6.6 | 7.0 | 10.2 | 3.0 | 3.0 | 1.0 | 10.0 | 8.5 | 4.6 | 3.0 | 0.0 | 3.8 | 4.0 | 4.0 | 1.0 | 9.0 | 0.0 | 6.0 | 39.5 |
| 96 | Crédit Agricole | France | 1.0 | 0.0 | 1.0 | 2.0 | 1.0 | 3.0 | 0.0 | 4.0 | 5.0 | 2.5 | 2.0 | 10.0 | 9.0 | 4.0 | 6.0 | 1.0 | 7.0 | 9.0 | 3.0 | 9.0 | 0.0 | 6.0 | 4.2 | 4.2 | 3.0 | 3.0 | 2.0 | 4.8 | 39.5 |
| 97 | National Bank of Kuwait | Kuwait | 1.0 | 2.0 | 0.0 | 4.0 | 0.0 | 7.0 | 0.0 | 7.0 | 3.0 | 1.5 | 6.0 | 7.0 | 9.8 | 1.0 | 2.0 | 0.0 | 8.0 | 5.5 | 2.0 | 4.0 | 1.0 | 3.5 | 4.6 | 4.6 | 3.0 | 6.0 | 1.0 | 6.0 | 37.9 |
| 98 | Qatar National Bank | Qatar | 1.0 | 7.0 | 0.0 | 4.0 | 0.0 | 10.0 | 1.0 | 11.5 | 1.0 | 0.5 | 9.0 | 1.0 | 7.5 | 1.0 | 3.0 | 2.0 | 4.0 | 5.0 | 2.0 | 4.0 | 0.0 | 3.0 | 4.8 | 4.8 | 3.0 | 4.0 | 2.0 | 5.4 | 37.7 |
| 99 | Standard Bank | South Africa | 1.0 | 1.0 | 2.0 | 4.0 | 0.0 | 5.0 | 0.0 | 6.5 | 6.0 | 3.0 | 3.3 | 7.0 | 7.7 | 1.0 | 2.0 | 2.0 | 5.0 | 5.0 | 5.0 | 6.0 | 4.0 | 7.5 | 4.4 | 4.4 | 3.0 | 0.0 | 1.0 | 2.4 | 36.5 |
| 100 | BRI | Indonesia | 1.0 | 1.0 | 3.0 | 0.0 | 0.0 | 3.0 | 0.0 | 4.0 | 4.0 | 2.0 | 3.2 | 10.0 | 9.9 | 1.0 | 2.0 | 2.0 | 10.0 | 7.5 | 1.5 | 3.0 | 3.0 | 3.8 | 4.7 | 4.7 | 3.0 | 3.0 | 1.0 | 4.2 | 36.1 |
Methodology: The scorecard assessment covers capabilities mapped across seven critical dimensions: retail financial performance, retail focus, digital customer base, brand strength, sales management, customer experience, and risk management.
Source: TABInsights
A correlation analysis across 100 global retail banks in FY25 finds a weak but statistically significant negative relationship between asset…
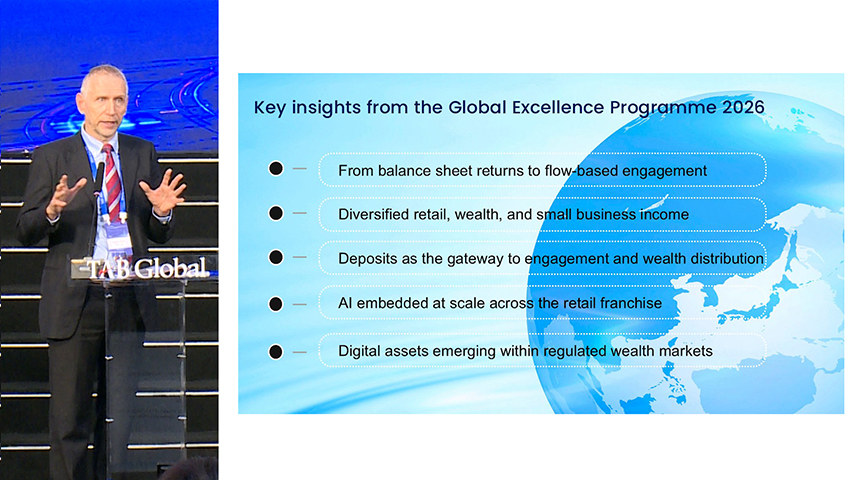
This year's TAB Global Excellence in Retail Financial Services Awards 2026 reveals three forces reshaping retail banking in ways that…
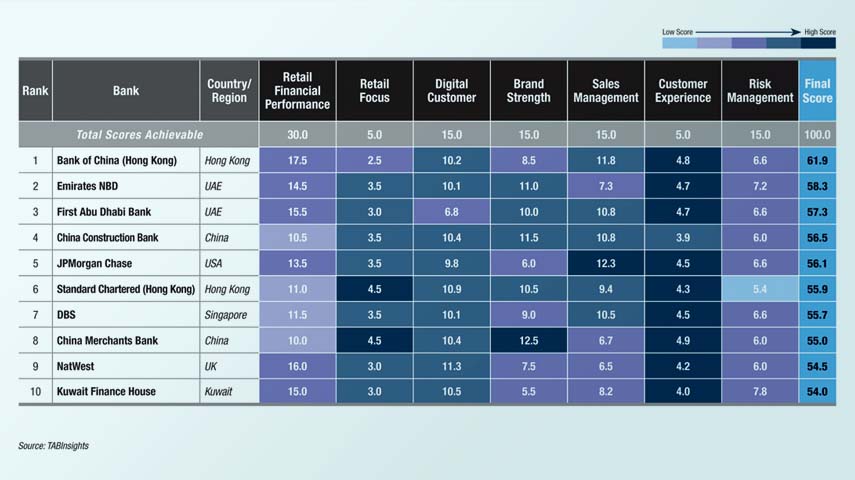
Bank of China (Hong Kong) leads the 2026 TAB Global World’s Best Retail Banks Ranking, ahead of Emirates NBD and…
TABInsights evaluates leading retail banks and ranks them based on their performance across seven critical areas: retail financial performance, retail focus, digital customer base, brand strength, sales management, customer experience, and risk management. This thorough assessment provides a detailed analysis of each institution’s strengths and performance across these dimensions.
| Rank | FI | Country/Region | Retail Financial Performance | Retail Focus | Digital Customer Base | Brand Strength | Sales Management | Customer Experience | Risk Management | Final score | ||||||||||||||||||||
|---|---|---|---|---|---|---|---|---|---|---|---|---|---|---|---|---|---|---|---|---|---|---|---|---|---|---|---|---|---|---|
| Revenue | Revenue growth FY2023 | Revenue growth FY2019-22 | ROA | Improvements in ROA | CIR | Improvements in CIR | Total Score | Portion of book is retail | Total Score | Digital active | Definition of digital active | Total Score | Deposits market share | Deposit growth FY2023 | Deposit growth FY2019-22 | Total Score | Digital sales | Fee income | Fee income growth | Total Score | Digital engagement | Average Android score | Total Score | Quality of book | Improvements in quality of book | Total Score | ||||
| Score | Score | Score | Score | Score | Score | Score | 20% | Score | 5% | Score | Score | 20% | Score | Score | Score | 20% | Score | Score | Score | 15% | Score | Score | 15% | Score | Score | 5% | ||||
| 5 | 10 | 5 | 10 | 10 | 10 | 10 | 20.0 | 10 | 5.0 | 10 | 10 | 20.0 | 10 | 10 | 5 | 20.0 | 10 | 10 | 10 | 15.0 | 5.0 | 10 | 15.0 | 10 | 10 | 5.0 | 100.0 | |||
| 1 | JPMorgan Chase | USA | 5.0 | 10.0 | 0.0 | 9.0 | 5.0 | 6.0 | 10.0 | 15.0 | 10.0 | 5.0 | 7.6 | 7.0 | 14.6 | 6.0 | 0.0 | 5.0 | 8.8 | 6.0 | 5.0 | 1.0 | 6.0 | 9.0 | 4.4 | 13.4 | 6.0 | 3.0 | 2.3 | 65.1 |
| 2 | Emirates NBD | UAE | 1.0 | 10.0 | 2.0 | 10.0 | 0.0 | 9.0 | 2.0 | 11.3 | 7.0 | 3.5 | 8.5 | 5.0 | 13.5 | 7.0 | 6.0 | 4.0 | 13.6 | 4.8 | 7.0 | 9.0 | 10.4 | 4.0 | 4.7 | 8.7 | 4.0 | 2.0 | 1.5 | 62.5 |
| 3 | Standard Chartered Hong Kong | Hong Kong | 1.0 | 8.0 | 1.0 | 4.0 | 4.0 | 4.0 | 10.0 | 10.7 | 10.0 | 5.0 | 7.0 | 7.0 | 14.0 | 5.0 | 5.0 | 1.0 | 8.8 | 7.2 | 8.0 | 5.0 | 10.1 | 5.0 | 4.5 | 9.5 | 10.0 | 0.0 | 2.5 | 60.6 |
| 4 | Commonwealth Bank of Australia | Australia | 1.0 | 10.0 | 1.0 | 4.0 | 1.0 | 8.0 | 6.0 | 10.3 | 10.0 | 5.0 | 5.1 | 7.0 | 12.1 | 7.0 | 3.0 | 3.0 | 10.4 | 5.2 | 3.0 | 5.0 | 6.6 | 10.0 | 3.7 | 13.7 | 8.0 | 1.0 | 2.3 | 60.4 |
| 5 | CaixaBank | Spain | 2.0 | 10.0 | 3.0 | 3.0 | 3.0 | 6.0 | 10.0 | 12.3 | 10.0 | 5.0 | 6.1 | 5.0 | 11.1 | 9.0 | 1.0 | 5.0 | 12.0 | 7.1 | 6.0 | 0.0 | 6.6 | 8.0 | 4.8 | 12.8 | 2.0 | 0.0 | 0.5 | 60.3 |
| 6 | Bank of China (Hong Kong) | Hong Kong | 1.0 | 10.0 | 0.0 | 6.0 | 7.0 | 7.0 | 10.0 | 13.7 | 9.0 | 4.5 | 3.6 | 10.0 | 13.6 | 6.0 | 4.0 | 2.0 | 9.6 | 6.5 | 6.0 | 3.0 | 7.8 | 4.0 | 4.8 | 8.8 | 9.0 | 0.0 | 2.3 | 60.2 |
| 7 | CTBC Bank | Taiwan | 1.0 | 9.0 | 3.0 | 3.0 | 0.0 | 5.0 | 3.0 | 8.0 | 10.0 | 5.0 | 8.0 | 5.0 | 13.0 | 3.0 | 6.0 | 3.0 | 9.6 | 5.7 | 10.0 | 9.0 | 12.4 | 4.0 | 4.8 | 8.8 | 9.0 | 1.0 | 2.5 | 59.3 |
| 8 | HSBC | Global | 2.0 | 10.0 | 0.0 | 3.0 | 4.0 | 5.0 | 10.0 | 11.3 | 10.0 | 5.0 | 5.4 | 10.0 | 15.4 | 7.0 | 2.0 | 2.0 | 8.8 | 4.9 | 5.0 | 1.0 | 5.5 | 6.0 | 4.8 | 10.8 | 8.0 | 1.0 | 2.3 | 59.0 |
| 9 | UOB | Singapore | 1.0 | 10.0 | 0.0 | 5.0 | 3.0 | 5.0 | 5.0 | 9.7 | 7.0 | 3.5 | 4.7 | 10.0 | 14.7 | 6.0 | 6.0 | 1.0 | 10.4 | 4.0 | 6.0 | 10.0 | 10.0 | 4.0 | 4.6 | 8.6 | 6.0 | 1.0 | 1.8 | 58.6 |
| 10 | First National Bank (FirstRand) | South Africa | 1.0 | 6.0 | 1.0 | 9.0 | 1.0 | 4.0 | 0.0 | 7.3 | 10.0 | 5.0 | 3.9 | 7.0 | 10.9 | 5.0 | 5.0 | 3.0 | 10.4 | 6.0 | 10.0 | 7.0 | 11.5 | 7.0 | 4.8 | 11.8 | 0.0 | 0.0 | 0.0 | 56.9 |
| 11 | Standard Bank | South Africa | 1.0 | 9.0 | 1.0 | 5.0 | 2.0 | 5.0 | 4.0 | 9.0 | 10.0 | 5.0 | 3.2 | 7.0 | 10.2 | 5.0 | 4.0 | 3.0 | 9.6 | 5.0 | 6.0 | 7.0 | 9.0 | 9.0 | 4.7 | 13.7 | 0.0 | 0.0 | 0.0 | 56.5 |
| 12 | China Merchants Bank | China | 2.0 | 1.0 | 3.0 | 7.0 | 0.0 | 8.0 | 1.0 | 7.3 | 10.0 | 5.0 | 5.9 | 10.0 | 15.9 | 1.0 | 7.0 | 5.0 | 10.4 | 7.0 | 7.0 | 0.0 | 7.0 | 4.0 | 4.9 | 8.9 | 7.0 | 0.0 | 1.8 | 56.3 |
| 13 | Itaú Unibanco | Brazil | 2.0 | 4.0 | 2.0 | 3.0 | 0.0 | 6.0 | 2.0 | 6.3 | 9.0 | 4.5 | 5.0 | 7.0 | 12.0 | 8.0 | 6.0 | 4.0 | 14.4 | 7.0 | 7.0 | 3.0 | 8.5 | 5.0 | 4.3 | 9.3 | 0.0 | 3.0 | 0.8 | 55.8 |
| 14 | ING | Global | 2.0 | 10.0 | 0.0 | 3.0 | 3.0 | 5.0 | 10.0 | 11.0 | 10.0 | 5.0 | 6.5 | 7.0 | 13.5 | 7.0 | 2.0 | 1.0 | 8.0 | 7.5 | 4.0 | 0.0 | 5.8 | 7.0 | 4.1 | 11.1 | 6.0 | 0.0 | 1.5 | 55.9 |
| 15 | HDFC Bank | India | 2.0 | 10.0 | 3.0 | 3.0 | 0.0 | 5.0 | 0.0 | 7.7 | 10.0 | 5.0 | 6.0 | 3.0 | 9.0 | 6.0 | 10.0 | 5.0 | 16.8 | 4.0 | 4.0 | 5.0 | 6.5 | 4.0 | 4.4 | 8.4 | 7.0 | 2.0 | 2.3 | 55.6 |
| 16 | DBS | Singapore | 1.0 | 10.0 | 1.0 | 7.0 | 6.0 | 6.0 | 10.0 | 13.7 | 6.0 | 3.0 | 6.2 | 1.0 | 7.2 | 7.0 | 3.0 | 3.0 | 10.4 | 4.0 | 8.0 | 6.0 | 9.0 | 6.0 | 4.2 | 10.2 | 8.0 | 0.0 | 2.0 | 55.5 |
| 17 | Bank of Montreal | Canada | 1.0 | 10.0 | 2.0 | 4.0 | 0.0 | 5.0 | 0.0 | 7.3 | 9.0 | 4.5 | 3.5 | 7.0 | 10.5 | 6.0 | 10.0 | 3.0 | 15.2 | 3.3 | 5.0 | 6.0 | 7.2 | 4.0 | 4.2 | 8.2 | 9.0 | 0.0 | 2.3 | 55.1 |
| 18 | ANZ | Australia | 1.0 | 2.0 | 1.0 | 2.0 | 0.0 | 5.0 | 2.0 | 4.3 | 10.0 | 5.0 | 4.2 | 10.0 | 14.2 | 5.0 | 3.0 | 3.0 | 8.8 | 4.5 | 3.0 | 8.0 | 7.8 | 8.0 | 4.2 | 12.2 | 9.0 | 0.0 | 2.3 | 54.5 |
| 19 | BBVA (Spain) | Spain | 1.0 | 10.0 | 1.0 | 4.0 | 3.0 | 7.0 | 10.0 | 12.0 | 10.0 | 5.0 | 5.5 | 7.0 | 12.5 | 7.0 | 0.0 | 2.0 | 7.2 | 6.3 | 7.0 | 1.0 | 7.2 | 6.0 | 4.5 | 10.5 | 0.0 | 0.0 | 0.0 | 54.4 |
| 20 | ICICI Bank | India | 1.0 | 10.0 | 4.0 | 6.0 | 0.0 | 5.0 | 1.0 | 9.0 | 10.0 | 5.0 | 7.5 | 3.0 | 10.5 | 3.0 | 7.0 | 4.0 | 11.2 | 4.0 | 6.0 | 7.0 | 8.5 | 4.0 | 4.6 | 8.6 | 5.0 | 1.0 | 1.5 | 54.3 |
| 21 | OCBC Bank | Singapore | 1.0 | 10.0 | 0.0 | 4.0 | 3.0 | 4.0 | 10.0 | 10.7 | 7.0 | 3.5 | 5.1 | 7.0 | 12.1 | 6.0 | 3.0 | 2.0 | 8.8 | 4.0 | 8.0 | 1.0 | 6.5 | 6.0 | 4.4 | 10.4 | 8.0 | 1.0 | 2.3 | 54.2 |
| 22 | Bank of America | US | 3.0 | 5.0 | 1.0 | 3.0 | 0.0 | 5.0 | 2.0 | 6.3 | 9.0 | 4.5 | 6.7 | 7.0 | 13.7 | 5.0 | 0.0 | 4.0 | 7.2 | 4.9 | 5.0 | 0.0 | 5.0 | 10.0 | 4.6 | 14.6 | 8.0 | 1.0 | 2.3 | 53.5 |
| 23 | China Construction Bank | China | 4.0 | 2.0 | 3.0 | 5.0 | 0.0 | 8.0 | 2.0 | 8.0 | 8.0 | 4.0 | 2.6 | 10.0 | 12.6 | 5.0 | 7.0 | 4.0 | 12.8 | 5.2 | 4.0 | 5.0 | 7.1 | 4.0 | 3.0 | 7.0 | 8.0 | 0.0 | 2.0 | 53.5 |
| 24 | Lloyds Banking Group | UK | 1.0 | 0.0 | 1.0 | 3.0 | 0.0 | 4.0 | 0.0 | 3.0 | 10.0 | 5.0 | 8.0 | 3.0 | 11.0 | 6.0 | 0.0 | 2.0 | 6.4 | 5.0 | 5.0 | 10.0 | 10.0 | 10.0 | 4.6 | 14.6 | 10.0 | 2.0 | 3.0 | 53.0 |
| 25 | Nordea Bank | Finland | 1.0 | 10.0 | 1.0 | 3.0 | 2.0 | 6.0 | 7.0 | 10.0 | 10.0 | 5.0 | 4.2 | 7.0 | 11.2 | 5.0 | 0.0 | 1.0 | 4.8 | 5.5 | 5.0 | 0.0 | 5.3 | 10.0 | 4.5 | 14.5 | 8.0 | 0.0 | 2.0 | 52.8 |
| 26 | Standard Chartered | Global | 1.0 | 10.0 | 1.0 | 4.0 | 4.0 | 4.0 | 10.0 | 11.3 | 9.0 | 4.5 | 5.0 | 7.0 | 12.0 | 5.0 | 4.0 | 1.0 | 8.0 | 5.6 | 5.0 | 1.0 | 5.8 | 5.0 | 4.5 | 9.5 | 6.0 | 0.0 | 1.5 | 52.6 |
| 27 | Ping An Bank | China | 1.0 | 0.0 | 3.0 | 1.0 | 0.0 | 8.0 | 1.0 | 4.7 | 10.0 | 5.0 | 4.1 | 10.0 | 14.1 | 1.0 | 9.0 | 5.0 | 12.0 | 8.9 | 5.0 | 1.0 | 7.5 | 4.0 | 3.7 | 7.7 | 6.0 | 0.0 | 1.5 | 52.4 |
| 28 | HSBC Hong Kong | Hong Kong | 1.0 | 10.0 | 0.0 | 3.0 | 2.0 | 6.0 | 10.0 | 10.7 | 6.0 | 3.0 | 4.0 | 10.0 | 14.0 | 8.0 | 3.0 | 1.0 | 9.6 | 6.0 | 4.0 | 0.0 | 5.0 | 3.0 | 4.6 | 7.6 | 9.0 | 1.0 | 2.5 | 52.4 |
| 29 | Royal Bank of Canada | Canada | 2.0 | 5.0 | 2.0 | 4.0 | 0.0 | 6.0 | 1.0 | 6.7 | 10.0 | 5.0 | 6.0 | 7.0 | 13.0 | 7.0 | 5.0 | 3.0 | 12.0 | 4.3 | 7.0 | 0.0 | 5.7 | 4.0 | 3.1 | 7.1 | 9.0 | 0.0 | 2.3 | 51.7 |
| 30 | KB Kookmin Bank | South Korea | 1.0 | 0.0 | 4.0 | 3.0 | 1.0 | 6.0 | 4.0 | 6.3 | 9.0 | 4.5 | 3.6 | 10.0 | 13.6 | 5.0 | 3.0 | 2.0 | 8.0 | 6.0 | 2.0 | 0.0 | 4.0 | 8.0 | 4.6 | 12.6 | 10.0 | 0.0 | 2.5 | 51.5 |
| 31 | Scotiabank | Canada | 2.0 | 5.0 | 0.0 | 3.0 | 0.0 | 6.0 | 0.0 | 5.3 | 10.0 | 5.0 | 4.0 | 7.0 | 11.0 | 6.0 | 5.0 | 2.0 | 10.4 | 5.1 | 5.0 | 3.0 | 6.6 | 5.0 | 4.8 | 9.8 | 8.0 | 0.0 | 2.0 | 50.1 |
| 32 | State Bank of India | India | 2.0 | 10.0 | 3.0 | 4.0 | 1.0 | 3.0 | 1.0 | 8.0 | 8.0 | 4.0 | 5.0 | 3.0 | 8.0 | 6.0 | 8.0 | 3.0 | 13.6 | 4.0 | 4.0 | 6.0 | 7.0 | 4.0 | 3.9 | 7.9 | 3.0 | 3.0 | 1.5 | 50.0 |
| 33 | Toronto-Dominion Bank | Canada | 2.0 | 7.0 | 4.0 | 3.0 | 0.0 | 6.0 | 1.0 | 7.7 | 10.0 | 5.0 | 6.0 | 7.0 | 13.0 | 9.0 | 0.0 | 3.0 | 9.6 | 4.0 | 5.0 | 0.0 | 4.5 | 4.0 | 3.8 | 7.8 | 9.0 | 0.0 | 2.3 | 49.8 |
| 34 | Wells Fargo | US | 3.0 | 3.0 | 0.0 | 6.0 | 5.0 | 3.0 | 10.0 | 10.0 | 9.0 | 4.5 | 5.0 | 7.0 | 12.0 | 4.0 | 0.0 | 3.0 | 5.6 | 4.8 | 5.0 | 0.0 | 4.9 | 6.0 | 4.8 | 10.8 | 7.0 | 1.0 | 2.0 | 49.8 |
| 35 | Agricultural Bank of China | China | 4.0 | 2.0 | 4.0 | 5.0 | 0.0 | 7.0 | 0.0 | 7.3 | 8.0 | 4.0 | 2.5 | 10.0 | 12.5 | 5.0 | 7.0 | 3.0 | 12.0 | 4.5 | 2.0 | 0.0 | 3.3 | 4.0 | 4.7 | 8.7 | 8.0 | 0.0 | 2.0 | 49.8 |
| 36 | Westpac Banking Corporation | Australia | 1.0 | 0.0 | 1.0 | 2.0 | 0.0 | 5.0 | 0.0 | 3.0 | 10.0 | 5.0 | 4.5 | 7.0 | 11.5 | 7.0 | 5.0 | 2.0 | 11.2 | 4.4 | 2.0 | 0.0 | 3.2 | 10.0 | 3.6 | 13.6 | 7.0 | 0.0 | 1.8 | 49.3 |
| 37 | National Australia Bank | Australia | 1.0 | 4.0 | 1.0 | 2.0 | 0.0 | 5.0 | 0.0 | 4.3 | 10.0 | 5.0 | 4.1 | 7.0 | 11.1 | 6.0 | 4.0 | 3.0 | 10.4 | 4.0 | 3.0 | 3.0 | 5.0 | 8.0 | 3.8 | 11.8 | 6.0 | 0.0 | 1.5 | 49.1 |
| 38 | Shinhan Bank | South Korea | 1.0 | 0.0 | 5.0 | 3.0 | 0.0 | 5.0 | 0.0 | 4.7 | 10.0 | 5.0 | 3.7 | 10.0 | 13.7 | 5.0 | 0.0 | 3.0 | 6.4 | 6.0 | 2.0 | 0.0 | 4.0 | 8.0 | 4.6 | 12.6 | 10.0 | 0.0 | 2.5 | 48.9 |
| 39 | Bank of China | China | 3.0 | 6.0 | 3.0 | 5.0 | 1.0 | 7.0 | 2.0 | 9.0 | 7.0 | 3.5 | 1.7 | 10.0 | 11.7 | 3.0 | 7.0 | 3.0 | 10.4 | 5.0 | 3.0 | 2.0 | 5.0 | 4.0 | 3.2 | 7.2 | 8.0 | 0.0 | 2.0 | 48.8 |
| 40 | DNB Bank | Norway | 1.0 | 10.0 | 2.0 | 3.0 | 2.0 | 6.0 | 9.0 | 11.0 | 10.0 | 5.0 | 3.5 | 5.0 | 8.5 | 7.0 | 2.0 | 3.0 | 9.6 | 3.0 | 5.0 | 0.0 | 4.0 | 4.0 | 4.6 | 8.6 | 6.0 | 1.0 | 1.8 | 48.5 |
| 41 | ICBC | China | 3.0 | 0.0 | 2.0 | 4.0 | 0.0 | 7.0 | 0.0 | 5.3 | 7.0 | 3.5 | 3.1 | 10.0 | 13.1 | 5.0 | 7.0 | 3.0 | 12.0 | 5.0 | 4.0 | 0.0 | 4.5 | 4.0 | 4.0 | 8.0 | 8.0 | 0.0 | 2.0 | 48.4 |
| 42 | Woori Bank | South Korea | 1.0 | 0.0 | 5.0 | 2.0 | 0.0 | 5.0 | 0.0 | 4.3 | 9.0 | 4.5 | 3.3 | 10.0 | 13.3 | 4.0 | 2.0 | 3.0 | 7.2 | 6.0 | 3.0 | 0.0 | 4.5 | 8.0 | 3.7 | 11.7 | 10.0 | 1.0 | 2.8 | 48.3 |
| 43 | Canadian Imperial Bank of Commerce | Canada | 1.0 | 3.0 | 1.0 | 2.0 | 1.0 | 5.0 | 1.0 | 4.7 | 10.0 | 5.0 | 4.9 | 7.0 | 11.9 | 6.0 | 2.0 | 3.0 | 8.8 | 4.5 | 5.0 | 0.0 | 4.8 | 7.0 | 3.8 | 10.8 | 9.0 | 0.0 | 2.3 | 48.2 |
| 44 | Barclays | UK | 1.0 | 4.0 | 1.0 | 2.0 | 0.0 | 3.0 | 3.0 | 4.7 | 10.0 | 5.0 | 2.5 | 7.0 | 9.5 | 6.0 | 5.0 | 2.0 | 10.4 | 5.5 | 5.0 | 3.0 | 6.8 | 6.0 | 4.4 | 10.4 | 4.0 | 0.0 | 1.0 | 47.7 |
| 45 | Bank of Communications | China | 2.0 | 1.0 | 1.0 | 3.0 | 0.0 | 6.0 | 3.0 | 5.3 | 7.0 | 3.5 | 2.6 | 10.0 | 12.6 | 1.0 | 7.0 | 4.0 | 9.6 | 4.5 | 7.0 | 0.0 | 5.8 | 4.0 | 4.8 | 8.8 | 7.0 | 1.0 | 2.0 | 47.6 |
| 46 | Banco Santander | Global | 4.0 | 3.0 | 1.0 | 2.0 | 0.0 | 6.0 | 1.0 | 5.7 | 10.0 | 5.0 | 3.3 | 10.0 | 13.3 | 6.0 | 2.0 | 2.0 | 8.0 | 5.8 | 4.0 | 1.0 | 5.4 | 5.0 | 4.7 | 9.7 | 2.0 | 0.0 | 0.5 | 47.6 |
| 47 | Saudi National Bank | Saudi Arabia | 1.0 | 5.0 | 3.0 | 5.0 | 1.0 | 6.0 | 4.0 | 8.3 | 10.0 | 5.0 | 5.0 | 5.0 | 10.0 | 7.0 | 3.0 | 0.0 | 8.0 | 7.3 | 2.0 | 0.0 | 4.7 | 5.0 | 4.4 | 9.4 | 8.0 | 0.0 | 2.0 | 47.4 |
| 48 | Rabobank | Netherlands | 1.0 | 10.0 | 0.0 | 4.0 | 4.0 | 6.0 | 10.0 | 11.7 | 10.0 | 5.0 | 3.0 | 5.0 | 8.0 | 6.0 | 1.0 | 3.0 | 8.0 | 3.0 | 4.0 | 3.0 | 5.0 | 3.0 | 4.3 | 7.3 | 8.0 | 0.0 | 2.0 | 47.0 |
| 49 | Al Rajhi Bank | Saudi Arabia | 1.0 | 6.0 | 2.0 | 4.0 | 2.0 | 6.0 | 3.0 | 8.0 | 10.0 | 5.0 | 8.0 | 1.0 | 9.0 | 6.0 | 0.0 | 1.0 | 5.6 | 4.0 | 3.0 | 1.0 | 4.0 | 8.0 | 4.5 | 12.5 | 9.0 | 1.0 | 2.5 | 46.6 |
| 50 | Crédit Agricole | France | 1.0 | 5.0 | 2.0 | 2.0 | 1.0 | 4.0 | 5.0 | 6.7 | 9.0 | 4.5 | 1.8 | 10.0 | 11.8 | 6.0 | 1.0 | 2.0 | 7.2 | 4.0 | 8.0 | 0.0 | 6.0 | 5.0 | 3.4 | 8.4 | 4.0 | 0.0 | 1.0 | 45.6 |
Methodology: The scorecard assessment covers capabilities mapped across seven critical dimensions: retail financial performance, retail focus, digital customer base, brand strength, sales management, customer experience, and risk management.
Source: TABInsights
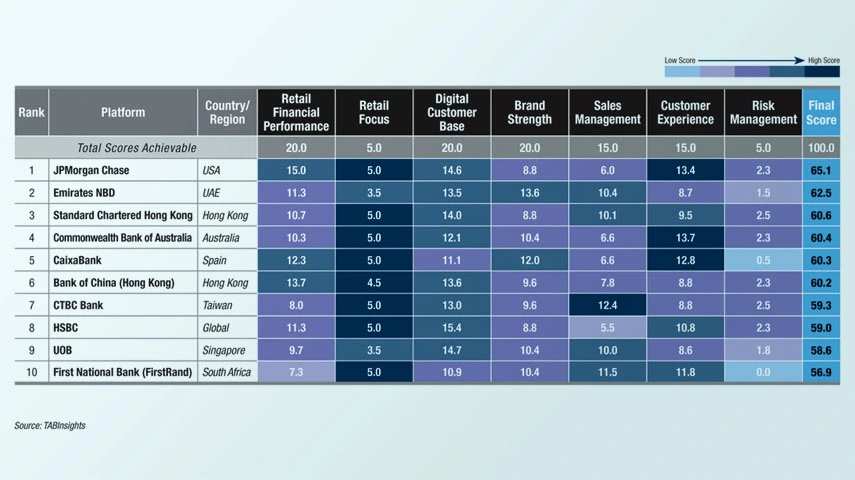
JPMorgan Chase, Emirates NBD and Standard Chartered Hong Kong top TABInsights World’s Best Retail Banks Ranking, with the top 50…
TABInsights tested the world's 26 largest and strongest retail banks in key markets globally and produced a comprehensive ranking that evaluates their capabilities across six critical dimensions: retail financial performance, digital customer base, brand strength, sales management, customer experience and risk management.
| Rank | FI | Country/Region | Retail Financial Performance | Digital Customer Base | Brand Strength | Sales Management | Customer Experience | Risk Management | Final score | ||||||||||||||||
|---|---|---|---|---|---|---|---|---|---|---|---|---|---|---|---|---|---|---|---|---|---|---|---|---|---|
| Revenue | Revenue Growth | ROE | CIR | Improvements in CIR | Total Score | Digital active | Definition of digital active | Total Score | Deposits market share | Deposit growth | Total Score | Digital sales | Fee income | Total Score | Digital engagement | Net promoter score | Average Android score | Total Score | Quality of book | Improvements in quality of book | Total Score | ||||
| Score | Score | Score | Score | Score | 20% | Score | Score | 20% | Score | Score | 20% | Score | Score | 20% | Score | Score | Score | 10% | Score | Score | 10% | ||||
| 10 | 10 | 10 | 10 | 10 | 10.0 | 10 | 10 | 10.0 | 10 | 10 | 10.0 | 10 | 10 | 10.0 | 10 | 10 | 5 | 5.0 | 10.0 | 10.0 | 5.0 | 50.0 | |||
| 1 | CaixaBank | Spain | 3.0 | 7.0 | 2.0 | 5.0 | 10.0 | 5.4 | 6.1 | 5.0 | 5.6 | 9.0 | 1.0 | 5.0 | 6.5 | 7.0 | 6.8 | 8.0 | 5.8 | 4.1 | 3.6 | 2.0 | 6.0 | 2.0 | 28.3 |
| 2 | Itau Unibanco | Brazil | 3.0 | 6.0 | 4.0 | 6.0 | 10.0 | 5.8 | 5.0 | 7.0 | 6.0 | 9.0 | 4.0 | 6.5 | 7.0 | 6.0 | 6.5 | 4.0 | 7.2 | 4.4 | 3.1 | 0.0 | 0.0 | 0.0 | 27.9 |
| 3 | JPMorgan Chase | US | 10.0 | 2.0 | 10.0 | 4.0 | 3.0 | 5.8 | 9.1 | 7.0 | 8.1 | 6.0 | 3.0 | 4.5 | 6.0 | 3.0 | 4.5 | 7.0 | 3.5 | 4.4 | 3.0 | 7.0 | 1.0 | 2.0 | 27.8 |
| 4 | CCB | China | 10.0 | 4.0 | 7.0 | 8.0 | 0.0 | 5.8 | 2.8 | 10.0 | 6.4 | 6.0 | 5.0 | 5.5 | 5.0 | 3.0 | 4.0 | 5.0 | 3.7 | 3.5 | 2.4 | 9.0 | 0.0 | 2.3 | 26.4 |
| 5 | CTBC Bank | Taiwan | 1.0 | 6.0 | 6.0 | 5.0 | 1.0 | 3.8 | 3.8 | 10.0 | 6.9 | 3.0 | 3.0 | 3.0 | 7.0 | 9.0 | 8.0 | 5.0 | 1.0 | 4.8 | 2.2 | 10.0 | 0.0 | 2.5 | 26.4 |
| 6 | CMB | China | 4.0 | 6.0 | 9.0 | 8.0 | 3.0 | 6.0 | 3.5 | 10.0 | 6.8 | 1.0 | 6.0 | 3.5 | 7.0 | 6.0 | 6.5 | 4.0 | 2.7 | 3.7 | 2.1 | 6.0 | 0.0 | 1.5 | 26.3 |
| 7 | Bank of America | US | 6.0 | 4.0 | 5.0 | 5.0 | 10.0 | 6.0 | 6.6 | 7.0 | 6.8 | 5.0 | 3.0 | 4.0 | 4.9 | 3.0 | 4.0 | 10.0 | 0.0 | 4.6 | 2.9 | 8.0 | 1.0 | 2.3 | 25.9 |
| 8 | Garanti BBVA | Turkey | 1.0 | 2.0 | 9.0 | 6.0 | 0.0 | 3.6 | 5.8 | 7.0 | 6.4 | 4.0 | 2.0 | 3.0 | 8.5 | 8.0 | 8.3 | 8.0 | 5.0 | 4.5 | 3.5 | 3.0 | 1.0 | 1.0 | 25.8 |
| 9 | Royal Bank of Canada | Canada | 3.0 | 4.0 | 7.0 | 6.0 | 4.0 | 4.8 | 6.0 | 7.0 | 6.5 | 7.0 | 3.0 | 5.0 | 4.2 | 5.0 | 4.6 | 6.0 | 0.8 | 3.7 | 2.1 | 10.0 | 1.0 | 2.8 | 25.8 |
| 10 | Ping An Bank | China | 3.0 | 4.0 | 5.0 | 8.0 | 8.0 | 5.6 | 3.2 | 10.0 | 6.6 | 1.0 | 5.0 | 3.0 | 8.3 | 4.0 | 6.2 | 6.0 | 3.6 | 4.2 | 2.8 | 5.0 | 1.0 | 1.5 | 25.6 |
| 11 | BBVA (Spain) | Spain | 2.0 | 3.0 | 3.0 | 6.0 | 9.0 | 4.6 | 5.5 | 7.0 | 6.3 | 7.0 | 2.0 | 4.5 | 5.7 | 7.0 | 6.4 | 6.0 | 4.0 | 4.5 | 2.9 | 0.0 | 3.0 | 0.8 | 25.4 |
| 12 | UOB | Group | 1.0 | 4.0 | 5.0 | 5.0 | 0.0 | 3.0 | 4.6 | 10.0 | 7.3 | 6.0 | 5.0 | 5.5 | 5.1 | 4.0 | 4.6 | 8.0 | 2.5 | 4.3 | 3.0 | 5.0 | 1.0 | 1.5 | 24.8 |
| 13 | ICBC | China | 9.0 | 2.0 | 6.0 | 7.0 | 0.0 | 4.8 | 2.2 | 10.0 | 6.1 | 6.0 | 4.0 | 5.0 | 5.6 | 3.0 | 4.3 | 3.0 | 3.8 | 3.4 | 2.0 | 8.0 | 0.0 | 2.0 | 24.2 |
| 14 | DBS | Group | 1.0 | 4.0 | 6.0 | 4.0 | 10.0 | 5.0 | 6.0 | 1.0 | 3.5 | 7.0 | 2.0 | 4.5 | 5.0 | 5.0 | 5.0 | 6.0 | 3.3 | 4.3 | 2.7 | 9.0 | 1.0 | 2.5 | 23.2 |
| 15 | ING | Global | 3.0 | 0.0 | 10.0 | 3.0 | 1.0 | 3.4 | 5.8 | 7.0 | 6.4 | 6.0 | 1.0 | 3.5 | 7.3 | 3.0 | 5.2 | 7.0 | 4.0 | 4.1 | 3.0 | 5.0 | 2.0 | 1.8 | 23.2 |
| 16 | Banco Santander | Spain | 7.0 | 3.0 | 3.0 | 6.0 | 0.0 | 3.8 | 3.2 | 10.0 | 6.6 | 9.0 | 3.0 | 6.0 | 5.6 | 3.0 | 4.3 | 6.0 | 0.0 | 3.9 | 2.0 | 1.0 | 1.0 | 0.5 | 23.2 |
| 17 | CBA | Australia | 2.0 | 0.0 | 5.0 | 7.0 | 0.0 | 2.8 | 5.0 | 10.0 | 7.5 | 6.0 | 4.0 | 5.0 | 5.0 | 1.0 | 3.0 | 9.0 | 1.0 | 4.1 | 2.8 | 7.0 | 1.0 | 2.0 | 23.1 |
| 18 | HSBC | Global | 4.0 | 4.0 | 3.0 | 3.0 | 10.0 | 4.8 | 4.3 | 10.0 | 7.2 | 7.0 | 0.0 | 3.5 | 6.0 | 1.0 | 3.5 | 6.0 | 1.3 | 2.1 | 1.9 | 7.0 | 2.0 | 2.3 | 23.1 |
| 19 | Absa | Group | 1.0 | 7.0 | 4.0 | 6.0 | 9.0 | 5.4 | 2.6 | 5.0 | 3.8 | 5.0 | 3.0 | 4.0 | 4.5 | 8.0 | 6.3 | 6.0 | 4.4 | 4.8 | 2.7 | 0.0 | 3.0 | 0.8 | 22.9 |
| 20 | Nordea | Group | 1.0 | 4.0 | 2.0 | 6.0 | 4.0 | 3.4 | 4.0 | 7.0 | 5.5 | 5.0 | 1.0 | 3.0 | 5.5 | 6.0 | 5.8 | 6.0 | 3.0 | 4.2 | 2.6 | 8.0 | 1.0 | 2.3 | 22.5 |
| 21 | FirstRand | Group | 1.0 | 2.0 | 10.0 | 5.0 | 0.0 | 3.6 | 3.8 | 5.0 | 2.7 | 6.0 | 3.0 | 4.5 | 5.0 | 9.0 | 7.0 | 10.0 | 4.5 | 4.5 | 2.8 | 0.0 | 7.0 | 1.8 | 22.3 |
| 22 | Barclays | UK | 3.0 | 5.0 | 2.0 | 3.0 | 10.0 | 4.6 | 2.5 | 7.0 | 4.8 | 6.0 | 3.0 | 4.5 | 5.5 | 4.0 | 4.8 | 6.0 | 3.4 | 4.4 | 2.8 | 3.0 | 0.0 | 0.8 | 22.1 |
| 23 | StanChart | Global | 1.0 | 4.0 | 2.0 | 3.0 | 10.0 | 4.0 | 6.3 | 1.0 | 3.7 | 6.0 | 1.0 | 3.5 | 7.4 | 4.0 | 5.7 | 6.0 | 3.8 | 3.5 | 2.7 | 5.0 | 1.0 | 1.5 | 21.0 |
| 24 | Westpac | Australia | 2.0 | 0.0 | 3.0 | 6.0 | 1.0 | 2.4 | 4.6 | 7.0 | 5.8 | 6.0 | 3.0 | 4.5 | 4.4 | 1.0 | 2.7 | 8.0 | 0.0 | 3.6 | 2.3 | 7.0 | 2.0 | 2.3 | 20.0 |
| 25 | NedBank | Group | 1.0 | 4.0 | 8.0 | 4.0 | 3.0 | 4.0 | 3.9 | 5.0 | 4.5 | 4.0 | 0.0 | 2.0 | 5.3 | 7.0 | 6.2 | 6.0 | 4.7 | 3.7 | 2.9 | 0.0 | 0.0 | 0.0 | 19.5 |
| 26 | Citigroup | Global | 4.0 | 2.0 | 3.0 | 3.0 | 0.0 | 2.4 | 3.3 | 7.0 | 5.2 | 3.0 | 0.0 | 1.5 | 6.0 | 1.0 | 3.5 | 7.0 | 2.9 | 4.8 | 2.9 | 6.0 | 0.0 | 1.5 | 17.0 |
Methodology: The scorecard assessment covers capabilities mapped across six key dimensions: retail financial performance, digital customer base, brand strength, sales management, customer experience, and risk management.
Source: TABInsights
© Copyright , TABInsights. All Rights Reserved

Brian Lo is a seasoned risk professional with nearly 30 years of experience across global financial institutions. Based in Hong Kong and Singapore, he has led teams in managing market and liquidity risk, counterparty risk, and asset and liability management. His expertise encompasses quantitative modelling, risk governance, stress testing, and regulatory compliance. Brian has also played a critical role in developing internal risk models, driving strategic initiatives, and advising on cutting-edge risk solutions, including AI and machine learning applications. Throughout his career, he has served on multiple risk committees, providing strategic insights to senior management and boards, and has been instrumental in implementing Basel reforms and risk management innovations. Brian’s approach integrates deep technical knowledge with practical leadership, making him a valuable contributor to banking risk management education and practice.

Urs Bolt is a seasoned professional with over 35 years of expertise in wealth management, investment banking, and technology. He helps individuals achieve financial well-being and advises senior leaders in financial services and technology on refining business strategies, developing markets, and forging impactful partnerships. Recognised as a global thought leader in digital banking, WealthTech, and decentralised finance, Urs is an active speaker, author, and jury member for esteemed awards and panels. A passionate advocate for sustainable progress, he champions energy policies that balance economic growth and ecological preservation through scientific solutions.

Sina is Chief Data Officer at Unique AG – a rising European startup providing a GenAI-driven platform called Unique.AI to better understand customers and build more meaningful client relationships. Unique.AI is a tailored solution for the financial industry that aims to increase productivity by automating manual workload through AI and ChatGPT solutions.
Sina is a proven GenAI and data transformation specialist for financial applications with over 20 years of experience. Before Unique AG, Sina led data strategy projects at Credit Suisse AG and worked as a consultant at Accenture AG. She lectures on GenAI, AI Governance, and Data Protection at top universities like HSG St. Gallen and HEC Paris, inspiring future tech leaders. Sina also mentors startups on GenAI applications and serves on the ISO expert council in Switzerland. She was recently honored with the “Women in Banking and Fintech 2024” award for her Thought Leadership on Data Protection and AI Governance for GenAI applications for Financial Services by Handelsblatt (#1 business newspaper in Germany). Sina holds a PhD in Financial Modeling from the University of St. Gallen (HSG, Switzerland) and a Diploma in Economics from the University of Mannheim (Germany).

John Januszczak is a seasoned fintech leader and the President & CEO of UBX Philippines, the fintech venture studio and fund of Union Bank of the Philippines. He was appointed to this role after joining UnionBank as a Consultant in 2018. Prior to this, he served as the Chief Operating Officer of Manulife Philippines and held leadership roles such as Head of Global Business Process Management at Manulife Financial and Vice President of Product Management at Meta Software Corporation. His extensive experience in operations, technology, and financial services has positioned him as a key driver of digital transformation in the fintech space.
Under John’s leadership, UBX has grown into Southeast Asia’s fastest-growing fintech, building a robust ecosystem that helps startups and fintech founders access expertise, funding, and customers. He has spearheaded the incubation of award-winning ventures such as i2i, SeekCap, and BUX, while also managing a corporate venture fund that successfully invests in and scales fintech startups. By leveraging corporate ecosystems, open finance, and embedded finance, John continues to drive financial inclusion, innovation, and strategic growth in the Philippine fintech landscape.

Jonny Fry led initiatives around blockchain and digital assets within the regulated banking environment at ClearBank. With over three decades of experience in financial services, Jonny is widely recognised as a thought leader in digital innovation. He is currently the CEO of TeamBlockchain, Chairman of Gemini Capital UK, and author of Digital Bytes, a weekly publication analysing blockchain developments. At ClearBank, he focused on integrating digital asset strategies to support institutional-grade infrastructure for next-generation financial services. In 2022, he was named CryptoAM’s “Influencer of the Year.”.

David Parsons is an accomplished technology executive with over 25 years of experience leading digital financial infrastructure initiatives across the US and Europe. As Chief Technology Officer at NiftyOne, he drives innovation, technology strategy, and platform development. His expertise spans go-to-market strategies, business development, and regulatory frameworks, underpinned by a strong track record of working with global technology providers, hardware manufacturers, and software developers. David’s strategic vision and hands-on leadership have consistently enabled the successful deployment of scalable, secure, and compliant digital solutions in the financial sector.

Helen Child is the Founder and CEO of Open Banking Excellence (OBE), the world’s leading community of Open Banking and Open Finance pioneers. With a legacy of innovation rooted in her family’s 400-year history in banking, Helen’s journey includes founding the UK’s first e-Money Licence Issuer to be awarded licences by Mastercard and Visa. She has played a pivotal role in the development of the UK’s Open Banking ecosystem and has become a global ambassador for the movement, advising governments and regulators in emerging markets like Brazil and Saudi Arabia.

Sandeep Deobhakta is a veteran financial services leader and design innovator with over 35 years of experience spanning banking, wealth management, and bancassurance across ten countries. He has held senior roles at major institutions including Citibank, Shinsei Bank in Japan where he helped transform it into an award-winning digital retail bank using Human-Centered Design and VP Bank in Vietnam, where he drove significant retail banking growth. Most recently, he served as President & CEO of Manulife China Bank Life Assurance Corporation in the Philippines, steering innovation in bancassurance and strategic partnerships.
A champion of innovation at the intersection of finance and design, Sandeep is currently pursuing PhD research focused on AI and Design Thinking in financial services. He is the author of Banking by Design (2024) and teaches fintech at Dai Nam University in Vietnam.

With over 25 years of experience in strategy, finance, banking, and innovation, Rafiza Ghazali currently serves as the CEO of KAF Digital Bank, where she is responsible for the development and operationalisation of the retail/consumer digital bank. She brings deep expertise in corporate finance, Islamic finance, and fintech to her leadership role.
Previously, she was the Group CEO of Cradle Fund, where she played a key role in transforming Malaysia’s early-stage funding and venture capital ecosystem. Her extensive C-suite experience spans across various sectors including consumer products and services, energy, property, and media—where she has contributed to enhancing performance, governance, and sustainability. Rafiza is a Chartered Accountant with the Australian Institute of Chartered Accountants. She also holds a Postgraduate Diploma in Strategy and Innovation from the University of Oxford and a BSc in Economics from the London School of Economics. She is passionate about creating meaningful impact through digital innovation in banking and advancing financial inclusion. She is also deeply committed to fostering a culture of collaboration, diversity, and excellence across her teams and stakeholders.

Tiravat Assavapokee is currently the Executive Vice President and Head of Data Intelligent and IT Integration Division at KASIKORNBANK Public Company Limited, one of Thailand’s leading financial institutions. He is recognized as a pioneer in data science and AI transformation in the Thai banking sector, with more than two decades of international and domestic experience in data strategy, analytics, and operations research.
Prior to joining KASIKORNBANK, Dr. Assavapokee held several key leadership positions, including Executive Vice President for Data Innovation at Krung Thai Bank, and Executive Vice President for Business Intelligence at SCB. He also served in various leadership and senior analytics & data science roles at Capital One Bank ,Walmart and Manhattan Associates in the United States.
Dr. Assavapokee began his career in the U.S., where he also served as Assistant Professor in the Department of Industrial Engineering at the University of Houston. With over 21 years of studying and working in the United States and 8 years in Thailand, his career reflects a deep integration of global best practices with local business innovation.
He holds a Ph.D. and M.Sc. in Industrial and Systems Engineering from the Georgia Institute of Technology, another M.Sc. in Industrial and Manufacturing Engineering from Oregon State University, and a B.Sc. in Computer Science from King Mongkut’s Institute of Technology Ladkrabang (KMITL), Thailand.
Dr. Assavapokee is passionate about building data-AI driven organizations, fostering data-AI talent, and advancing responsible AI adoption in financial services.

John Januszczak is the former President and CEO of UBX, the fintech company originally established by UnionBank of the Philippines. Since assuming leadership in 2018, he has transformed UBX into a leading force in open and embedded finance across Southeast Asia. Under his guidance, UBX has processed billions in transactions, empowered more than 250,000 businesses, and forged strategic partnerships with global leaders such as SBI Holdings.
With a career spanning over three decades, John brings a wealth of experience in financial services, technology, and operations. Prior to UBX, he served as Chief Operating Officer at Manulife Philippines and held senior roles at Manulife Financial, MAXIMUS, and Meta Software Corporation. His expertise encompasses global business process management, product development, and digital transformation.
John is also a prominent advocate for financial inclusion and open finance. He chairs the European Chamber of Commerce of the Philippines' Special Committee on Open Finance and Financial Inclusion and has served on the boards of leading fintech and energy firms including PETNET, FinScore, Dragonpay and Solviva.
A native of Canada, John holds a degree in Astrophysics from the University of Toronto. His unique blend of scientific rigor and business acumen positions him at the forefront of fintech innovation in the region. John is a sought-after speaker at major industry events such as InsureTech Connect Asia and the Future Bank Working Group, where he shares insights on digital transformation, embedded finance, and the evolving fintech landscape.

With over 22 years of experience in transaction banking, treasury, and finance across Asia and the USA, Ankur Kanwar drives strategic growth and innovation in his dual leadership roles. As Head of Transaction Banking for Singapore and ASEAN, he oversees business growth and operational excellence in one of the region's most dynamic markets. In his global role as Head of Structured Solutions Development for Cash Management, he leads a team of experts in creating advanced cash management solutions for clients worldwide.
Ankur has helped large corporates optimise cash and treasury operations and spearheaded the adoption of transformative digital solutions to meet evolving industry needs. Before joining Standard Chartered, he held senior roles at JP Morgan Chase in Singapore and New York, leading transaction banking regulatory products and enhancing liquidity structures for corporate clients. His expertise in regulatory insights, treasury management, and balance sheet optimisation makes him a key influencer in transaction banking across ASEAN and beyond.

Allen Ng is Group Head and Principal Economist at the ASEAN+3 Macroeconomic Research Office (AMRO). He leads the Regional Surveillance group, which is responsible for the annual flagship ASEAN+3 Regional Economic Outlook and related updates.
He was previously the Chief Economist of Securities Commission Malaysia (SCM), where he was also a member of the International Organization of Securities Commissions’ Committee on Emerging Risks and a board member of the Institute for Capital Market Research Malaysia. Prior to SCM, Allen was Director of Research at Khazanah Research Institute, and before that he spent more than a decade in the Central Bank of Malaysia.

Sebastien joined Deutsche Bank in 2010 and currently leads Institutional Cash & Trade for APAC, based in Singapore. He oversees cash and trade businesses for institutional clients across the region, supported by a team of 50. Previously, he headed Trade Finance Distribution for APAC and led the Distribution franchise for the Middle East & Africa. With experience spanning Europe, Russia & CIS, and MEA, he has managed syndications and trade finance across major markets. Before Deutsche Bank, he spent nine years at BNP Paribas, focusing on loan syndications in the oil, gas, and commodities sectors.

Christo Georgiev is a seasoned financial technology executive with a strong track record in driving business growth and operational excellence across Southeast Asia. He is the founder and CEO of LenderLink, a company focused on advancing credit and lending innovation.
From 2019 to 2024, Christo served as Group COO and Country Manager (Philippines) at FinScore, a leading alternative credit scoring company. Under his leadership, the firm achieved 100% year-on-year revenue growth, forged strategic partnerships with over 30 top-tier financial institutions, and significantly broadened its market footprint and data capabilities. He led initiatives that processed millions of alternative data points monthly, advancing financial inclusion for the underbanked and unbanked.
Christo played a key role in raising $1.9 million from investors, including UBX Ventures (UnionBank of the Philippines’ CVC arm), and co-led FinScore’s successful exit to CTOS Digital of Malaysia in 2023. Following the acquisition, he remained with the company through its transition before stepping down in 2024 to launch LenderLink. Since 2012, Christo has held leadership roles across Operations and Business Development in Southeast Asia, building a reputation for strategic impact and execution in emerging fintech markets.

Frankie Shuai is the APAC Chief Information Security Officer (CISO) at DWS, Deutsche Bank Asset Management, with over two decades of experience in Financial and IT industries. As a seasoned leader, he previously directed cyber and technology risk at UBS for Singapore, Australia, and New Zealand, and has held positions at Citibank, Microsoft, and HP. Frankie is renowned for bridging the gap between cybersecurity and business agendas, evidenced by his frequent speaking engagements at industry events. His commitment to digital transformation and innovation is underscored by a patent for next-generation wireless networking filed with the United States Patent and Trademark Office, where he serves as the sole inventor. In his current role at Deutsche Bank Asset Management, he leads regional Information Security, contributing significantly to the institution's cybersecurity resilience.

David Gee is a distinguished former Global Head of Technology, Cyber, and Data Risk at Macquarie Group, celebrated for his transformative leadership across multiple industries and geographies. With over 25 years at the helm as CIO and CISO, including pivotal roles at HSBC Asia Pacific and MetLife, David has been instrumental in driving major digital transformations. He is notably recognized as the CIO of the Year 2014 for his strategic overhaul at Credit Union Australia, significantly enhancing their core and digital banking platforms. His latest book, The Aspiring CIO & CISO, published in July 2024, is a comprehensive guide for emerging leaders aiming to excel in top IT roles, offering strategies to develop leadership skills, build personal brands, and navigate executive challenges effectively.

Stephen Tjokro is a Business Development Director, Global Fraud Solutions at GBG. He has a keen interest in fraud management, cybersecurity, digital risk protection and enterprise software. With deep expertise in fraud management, he helps businesses navigate fraud risk challenges in an evolving digital landscape. Beyond his professional expertise, Stephen prioritises fitness and stays informed on emerging technology advancements, ensuring he remains at the forefront of innovation.

Patrick Schueffel is an adjunct professor at the School of Management Fribourg (HEG) in Switzerland, where he specialises in fintech, entrepreneurship in banking and finance, and innovation. His academic work is complemented by extensive professional experience in the financial services industry, having held senior and C-level roles at institutions in Switzerland and Liechtenstein, including Chief Operating Officer positions at Sora Bank and Saxo Bank (Switzerland). Earlier in his career, he served as a senior manager at Credit Suisse’s headquarters in Zurich, where he led a global innovation team.
Dr Schueffel also represented HEG Fribourg internationally during a three-year assignment in Singapore. His research has been widely published in leading academic journals and practitioner outlets, making a significant contribution to the fields of financial innovation and international business. He holds a doctorate from the University of Reading/Henley Business School, and postgraduate degrees from the Norwegian School of Economics (NHH), the University of Mannheim, and Henley Business School.

Kelvin Teo is the co-founder and Group CEO of Funding Societies | Modalku. He has been a key member of the Singapore FinTech Association’s Digital Finance Subcomm since 2018 and recently named by the Association as among the Top 12 Fintech Leaders in Singapore in 2020. As one of the Top 200 FinTech Influencers in Asia, Teo has spoken at major conferences such as LendIt Shanghai, Boao Hainan and Money20/20. He has also been featured on Bloomberg, BBC and Business Times. Prior to this, Teo served as a consulting professional at KKR, McKinsey and Accenture.

Mai Kaneko leads international business and marketing at DeCurret DCP, a Japanese fintech firm operating a multi-bank network for tokenized deposit under the DCJPY framework. She oversees international expansion initiatives, bank-fintech partnerships and global go-to-market strategy. She holds a Master’s in International Relations from Georgetown University and a Bachelor’s in Economics from University of Tokyo.

Kinoshita has been involved in product development projects across a wide range of industries in Japan, including e-commerce, retail, banking, insurance, and manufacturing. He joined DeCurret DCP in 2024, where he has been engaged in the development of digital currency infrastructure. In addition to building the underlying infrastructure, he supports digital transformation (DX) initiatives associated with the adoption of digital currency solutions across various industries, and promotes projects aimed at enabling cross-border transactions.

Jason Hunt works within ANZ's Industry & Innovation function, engaging with industry challenges, trends and disruptive technologies across payments, digital assets, platforms and data-driven solutions. ANZ was a participant in Project Acacia, the joint Reserve Bank of Australia (RBA) and Digital Finance Cooperative Research Centre (DFCRC) initiative exploring digital money in wholesale tokenised asset markets, which concluded with its final report in May 2026. ANZ has also previously issued its own Australian dollar-denominated stablecoin, A$DC, to settle a real-money digital asset transaction.

Zhu Kuang Lee leads UOB's Innovation Group, formed in April 2025 to consolidate the bank's work across digital assets, data management, blockchain and enterprise artificial intelligence. He represents UOB in regional digital money and tokenisation initiatives, including collaboration with the Monetary Authority of Singapore (MAS), and has described the bank's approach as embedding compliance into system design from the outset rather than adding it later.

Abhinav is currently based in Singapore and leads Client solutions and Sales for Partior. In this capacity, he oversees clients' journeys including commercial and central banks, from defining use cases to product integration. Before taking on this role, Abhinav gained extensive experience working with both global and local banks. He spearheaded transformative initiatives in Payments and Core Banking, requiring him to coordinate efforts across business units, technology teams, and regulatory bodies. Abhinav played a pivotal role in implementing Faster Payments projects throughout Asia, including notable projects like Singapore G3 Fast, Malaysia Duit Now, and Hong Kong FPS. Prior to his tenure in the banking sector, Abhinav served as a Payments Financial Services consultant to various banks and payment fintech companies such as ANZ, Deutsche Bank, and Bank of America. Originally from India, Abhinav holds an Engineering degree and a Postgraduate qualification in Machine Learning and Artificial Intelligence. He is also a dedicated father of two, and he enjoys spending his weekends playing tennis and cherishing moments with his family.

Sakae Hamasaki joined Sanwa Bank (currently MUFG Bank) in April 1993 and worked in corporate banking across five domestic locations. From 2006 onward, he gained extensive experience in the planning, development, and sales of payment-related services for corporate clients in Japan and overseas. He joined DeCurret DCP in 2022, where he has been leading initiatives to support banks in evaluating the adoption of tokenized deposits, as well as collaborating with overseas partners to build cross-border networks utilizing tokenized deposits.
You're just one step away from unlocking this content.
Become a Member today for full access.

Anouska Ladds is Executive Vice President of Commercial & New Payment Flows, Asia Pacific at Mastercard, based in Singapore. With over 17 years at Mastercard, she has held senior roles across sales, strategy, operations, market development, consultancy, and product development, spanning Asia Pacific, Europe, the Middle East, and Africa. Previously at Barclaycard, she specialised in strategy, customer experience, communications, and SME/acquiring businesses.

David is a seasoned technology executive with significant experience and has over 25 years' experience in CISO and CIO roles across different industries and countries. David has served as a CIO spans across multiple industries and geographies. He was winner Australia CIO of the Year for driving CUA's Transformation. Also, David was CISO for HSBC and Global Head Technology, Cyber and Data Risk Macquarie Group.
A regular conference keynote speaker and thought leader he writes for CIO, CSO, Computerworld and Australian Institute of Company Directors (AICD). His best-selling book - the Aspiring CIO & CISO was published in June 2024 and his second book A Day in the Life of a CISO launched in October 2025 and is already best seller in UK, Singapore, Japan and Australia.

Johnson is a seasoned executive and data and AI leader with over 15 years of experience across the public and private sectors. He is currently Assistant Chief Executive at IMDA, where he helps shape Singapore’s digital future and advance the digital economy. He has held senior data and AI roles in regional banking and global consulting, and began his career in defence and critical infrastructure.